


Landslides come with significant potential for loss of life and damage to integral infrastructure. That’s why geotechnical engineers dedicate significant time and effort into preventing them – but how can insight and understanding help if a landslide has already occurred?
In this case, geotechnical engineers require tools that will enable them to understand the cause of the landslide and conditions that may lead to further instability.
One method used to understand landslides is numerical analysis of the failed slope. This allows geotechnical engineers to explore various failure mechanisms and develop a hypothesis on the most likely causes of the landslide.
That’s exactly how 3D slope stability analysis in GeoStudio is helping in Canada’s Thompson River valley, where a high concentration of landslides affects important transportation routes.
Bringing clarity to a risky route
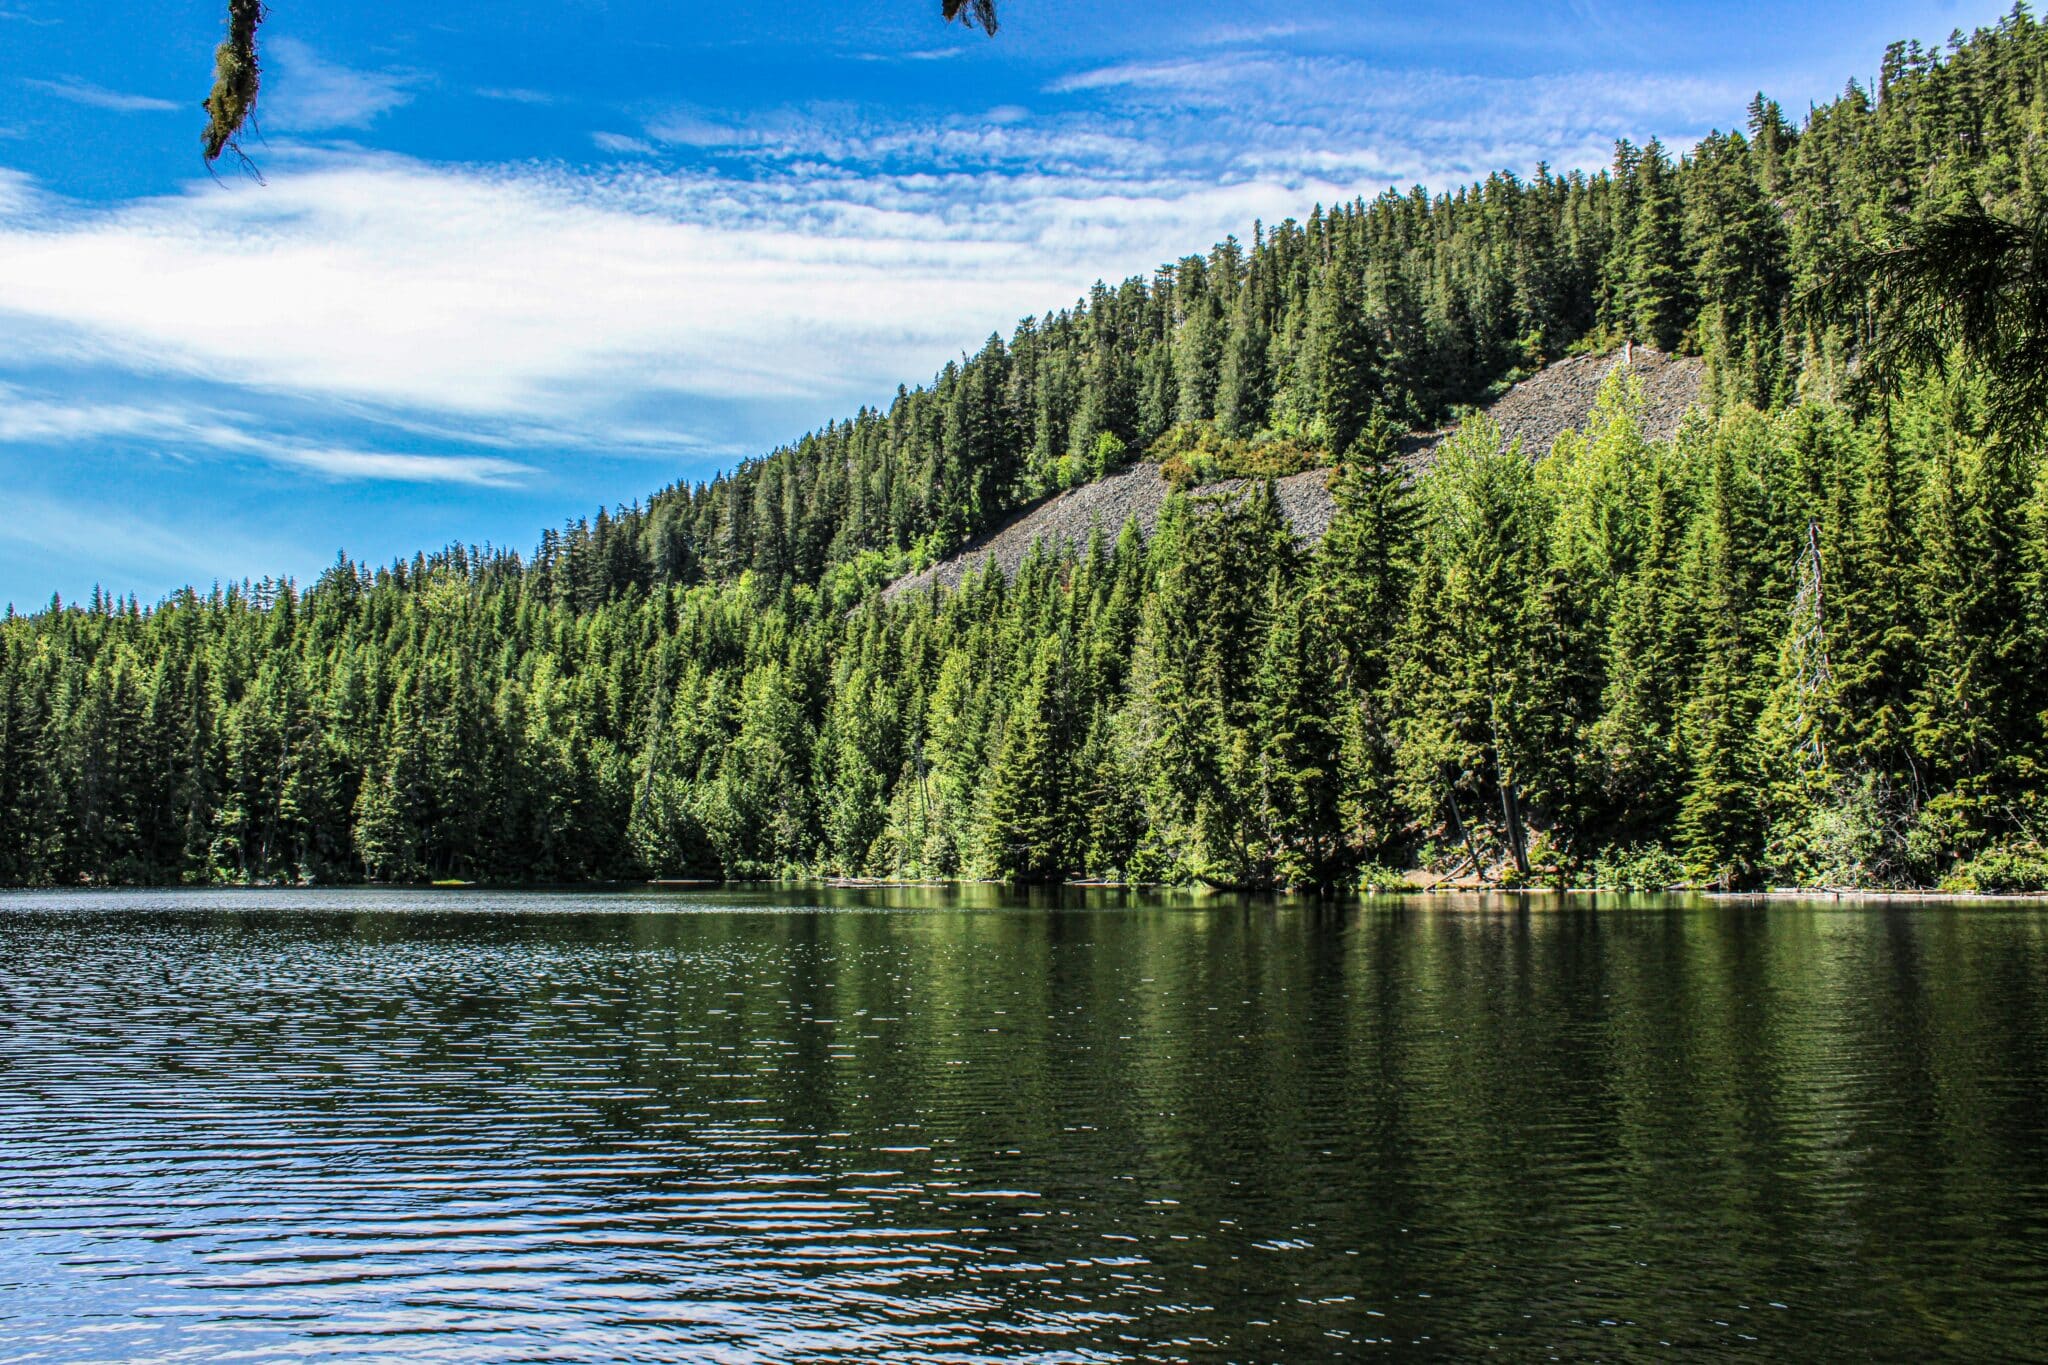
The Thompson River flows through central British Columbia from Kamloops to Lytton, where it meets the Fraser River. The surrounding valley is integral for transportation, as the Trans-Canada highway, Canadian Pacific Railway, and Canadian National Railway all run along the river. Some portions of the river valley are broad, while others are relatively steep due to downcutting of the river. The side slopes are largely unsaturated due to the region’s arid climate.
The regional stratigraphy was influenced by three separate glaciation events, with bedrock overlain by glaciolacustrine deposits, till, and glaciofluvial outwash (Sattler, 2022). The glaciolacustrine deposits also include layers of weak, non-swelling clays that contribute to instability by acting as sliding surfaces.
A number of landslides have occurred along the Thompson River due to the steep slopes, low regional water table, and presence of weak clay layers. One of these, the Ripley Landslide, is active – meaning that it continues to move, albeit at a very slow rate of 2 to 82 mm per year (Soltanieh and Macciotta, 2022). As a result, several studies have been conducted at the site to monitor the slide and understand the specific conditions causing instability.
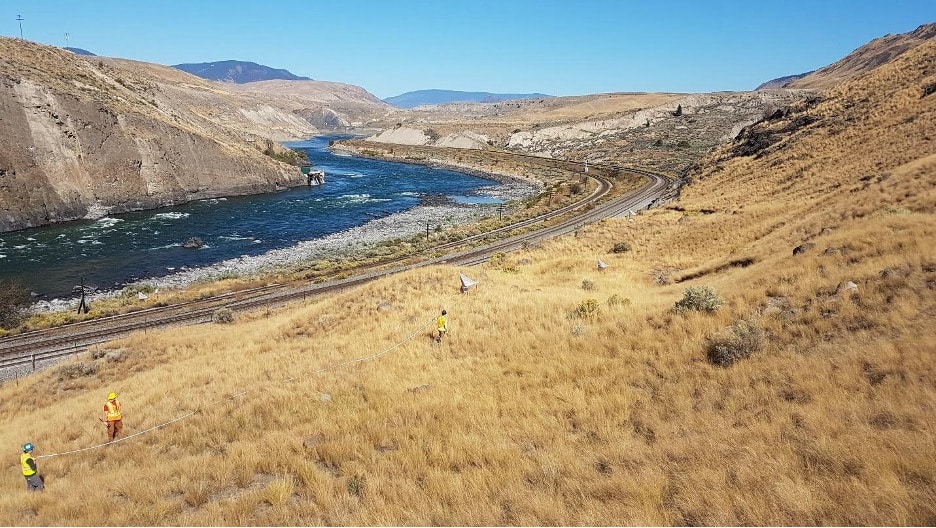
Ripley landslide from above (credit: Kelvin Sattler)
A robust investigation using multiple tools
Site investigations provided the necessary information to create a 3D model of the Ripley Landslide. Teams collected LiDAR data to define the detailed surface topography, while also undertaking geophysical and landform mapping, a robust subsurface analysis, and an instrumentation monitoring program.
Dr Kelvin Sattler from Clifton Engineering Group created a detailed stability analysis in PLAXIS LE as part of his PhD research. The intended purpose of this model was to conduct a limit equilibrium stability analysis and investigate the influence of changing pore water pressure conditions.
Dr Sattler and his team constructed the original 3D geomechanical model with LiDAR data for defining the site topography. They also interpreted subsurface stratigraphy based on borehole logs and geophysical and geology/landforms maps. Finally, they defined piezometric surfaces using measured river levels and existing data. According to Dr Sattler:
”Analysis of the Ripley Landslide site was challenging due to the complex pore water pressure conditions and desire to accurately represent infiltration at the ground surface as well as changing river levels. We wanted to make sure we had a good understanding of how unsaturated conditions and suction influenced stability at the site
Details of Dr. Sattler’s original PLAXIS LE stability and seepage analyses are illustrated in the following figures.
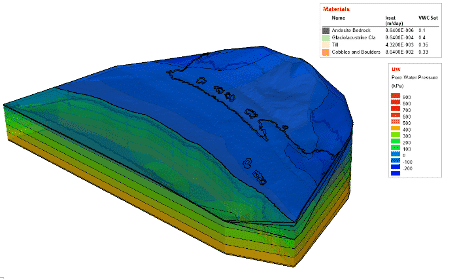
Simulated pore water pressures from PLAXIS LE (Week One)
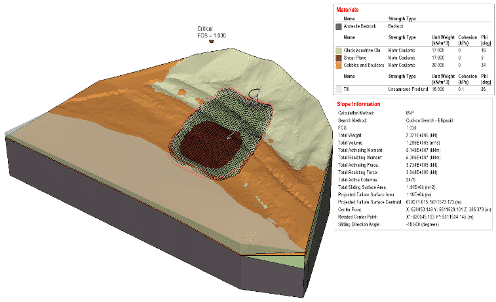
Simulated critical factor of safety from PLAXIS LE (Week One)
Bringing the analysis into GeoStudio
Given the retirement of PLAXIS LE (announced in 2023), we recreated the full numerical model in GeoStudio to verify the results. This included:
- 3D finite element groundwater seepage analysis (SEEP3D) to generate the complex water conditions
- 3D limit equilibrium stability analysis (SLOPE3D)
To couple these two types of analyses, 3D geometry in GeoStudio was necessary. Surfaces were fit to imported meshed surfaces, representing the topography and contact surfaces of the stratigraphic units, as shown below.
Note that, when conducting just 3D limit equilibrium analysis in GeoStudio, geometries can be imported geological model volumes (e.g. from Leapfrog or OBJ file import).
Importing contact surfaces as background mesh into GeoStudio
Fitting a surface to the background mesh
The seepage analysis used an imported piezometric surface from the project site as the initial water conditions. Similar to Dr Sattler’s model, two key boundary conditions were defined to represent (1) the measured river level over time and (2) the infiltration at the ground surface, above the river.
An initial 1D seepage analysis was used to assess the surface water balance and corresponding infiltration. To do so, the boundary condition applied at the ground surface evaluated the climatic conditions, including precipitation, air temperature, relative humidity, and evapotranspiration. Incorporating these conditions can be critical to properly simulate infiltration and unsaturated conditions. The computed water flux at the ground surface was applied as the boundary condition above the river level in the 3D seepage analysis.
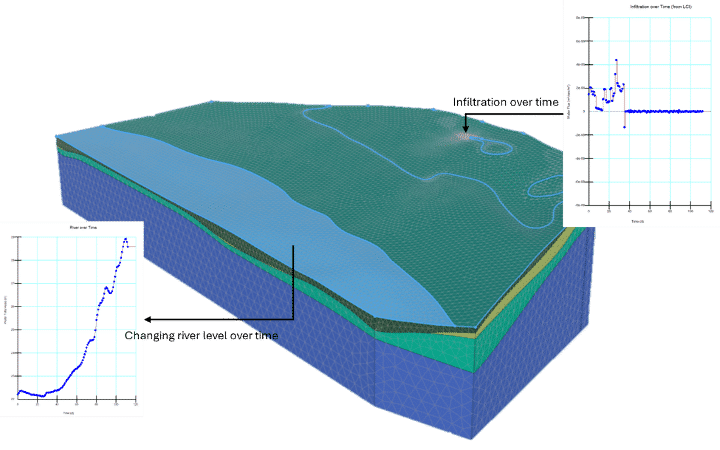
Groundwater seepage analysis definition
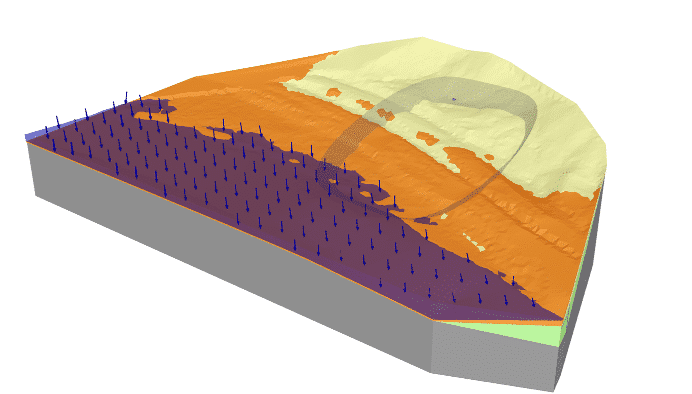
Stability analysis definition with water surcharge loads and fully specified slip surface displayed
The results from the 3D seepage analysis were used in the 3D stability analysis to investigate stability over time given changing pore water pressure conditions. As in PLAXIS LE, the Cuckoo search method is available in GeoStudio’s SLOPE3D. This method was used to compare the overall results of the GeoStudio analysis with the original PLAXIS LE model. In addition, the fully specified search method was also used in GeoStudio to replicate the slip surface with the lowest computed factor of safety from the original model. Finally, a weak surface represented the presence of the weak, swelling clays at the site.
GeoStudio in action
The 3D seepage analysis provided similar results to Dr Sattler’s original model. The factor of safety did vary with pore water pressure, but the results remained close to one throughout the simulated period. This supports the observations of the ongoing movement at the Ripley Landslide site and corresponds to Dr Sattler’s findings. The maximum variation in the critical factor of safety was 15% given the range of pore water pressure conditions investigated. Dr Sattler added:
”3D analysis determined that pore water pressure changes contributed at least 4% to the overall factor of safety, while the river buttressing effect increased the factor of safety by at least 11%. As a result, loss of suction coinciding with low river levels, would lead to destabilization of the slope at the Ripley landslide
Similar observations were noted while completing the GeoStudio model, highlighting the increased level of understanding when using 3D analysis methods to capture the complexities of natural landslides. The GeoStudio model validated the observation that landslide movement from year to year is likely related to changing pore water pressure conditions within the soils.
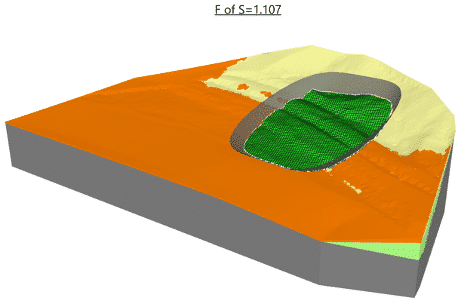
Fully specified slip surface with no optimization showed less than 0.36% difference with PLAXIS LE analysis
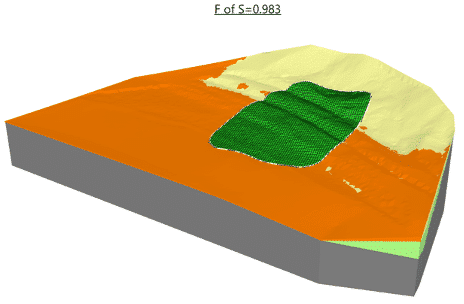
Fully specified with default optimization settings had less than 5% difference with PLAXIS LE analysis
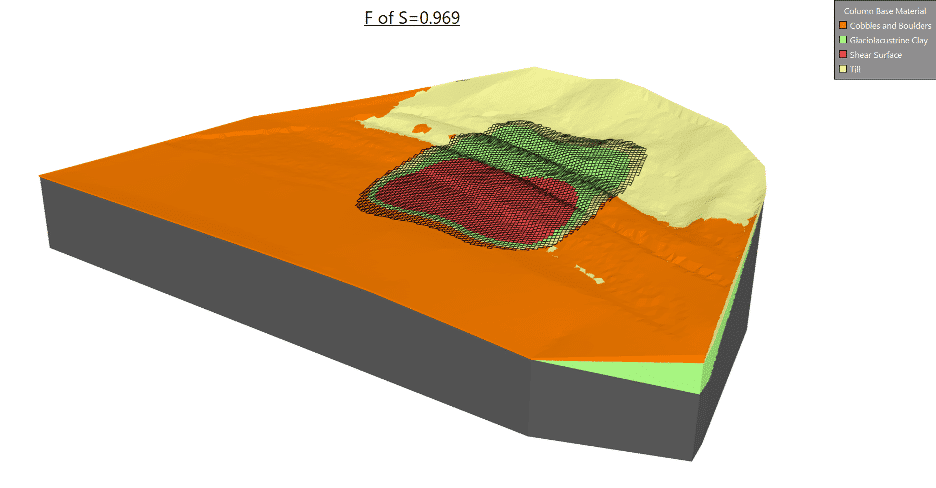
Cuckoo search method showed similar failure mechanism to the fully specified slip surface with a slightly lower factor of safety
Improved understanding
GeoStudio verified the observed failure mechanism of the Ripley Landslide and confirmed that the critical factor of safety over the applied range of pore water pressure conditions remained at or near one.
Integral features used in GeoStudio for this analysis were:
- The ability to easily couple 3D seepage and stability analyses
- The use of weak layers for defining a discontinuity
- The available search methods – Cuckoo search to investigate the critical failure area as well as fully-specified to replicate the PLAXIS LE results
This project highlights the benefits of using 3D analysis methods to understand the behavior of a natural landslide with complex groundwater and topographic components, as well as the seamless integration of GeoStudio’s 3D products with the previous capabilities of PLAXIS LE.
References
Sattler, K. 2022. Variable Suction and its Effect on Stability at the Ripley Landslide Near Ashcroft, British Columbia. University of Saskatchewan (PhD Thesis).
Soltanieh, A. and Macciotta, R. 2022. Updated Understanding of the Ripley Landslide Kinematics Using Satellite InSAR. Geosciences 12(8): 298. https://doi.org/10.3390/geosciences12080298
Acknowledgements
The following organisations provided support for the aforementioned research conducted on the Ripley landslide: NSERC, Railways Ground Hazards Research Program, Transport Canada, the Geological Survey of Canada, CN, and CPKC.