Introduction
Acidic leachate is produced when oxidation of sulphide occurs in an unsaturated system through which water transport is occurring. Soil cover systems with capillary barrier effects are often built to limit oxygen ingress towards mine wastes containing sulphide. Layers within the soil cover system that have a high water retention capacity also have a low coefficient of diffusion, which therefore limits oxygen ingress. Constructing the water retaining layer from tailings that consume oxygen has the added benefit of limiting oxygen transfer deeper into the mine wastes. The objective of this example is to analyze oxygen transport through an unsaturated cover system and explore the effectiveness of oxidation within the water retention unit.
Background
Gas transport in unsaturated soils can be described mathematically to varying degrees of rigor. CTRAN/W is formulated based on a rather generalized form of the gas transfer equation that considers hydrodynamic dispersion and advection of a gas species in the gas and dissolved phases:

where the 𝐷𝑎 and 𝐷𝑤 are the coefficients of hydrodynamic dispersion for gas transport in the gas and dissolved phases, respectively, 𝐻 the dimensionless form of Henry’s equilibrium constant (i.e. concentration of gas in solution divided by concentration of gas above solution), 𝑞𝑎 air flux, 𝑞𝑤 water
flux, 𝐾∗𝑟 the bulk reaction rate coefficient (1/s) for irreversible first order reaction processes such as oxidation, and 𝜆 the decay constant for radioactive decay or some reaction rate coefficient for biodegradation or hydrolysis. The equivalent diffusion porosity defined as:
The coefficients of hydrodynamic dispersion comprise both the coefficient of mechanical dispersion and bulk diffusion coefficient for each phase: (𝐷 = av) and bulk diffusion coefficient (D*d) for each phase:
and
In diffusion dominated systems in which the gaseous species does not decay, the transport equation simplifies to:

The use of a single bulk diffusion coefficient is often convenient for the purposes of developing 𝐷∗𝑑 analytical solutions for well-defined and relatively simple conditions (Mbonimpa et al. 2003). Equation 5 can be recast in terms of a single bulk diffusion coefficient 𝐷∗𝑑 as:

where 𝐷𝑒 is the effective coefficient of diffusion and 𝐾𝑒 the effective reaction rate coefficient.
Obtaining the required inputs for the case where 𝐷∗𝑑 is known can be done in one of three ways:

There are a number of closed form equations to estimate the diffusion coefficients. For example, Aachib et al. (2004) provided the following estimations for oxygen:

and,

where the exponents are evaluated as:

and the exponent y is evaluated as:

Numerical Simulation
Mbonimpa et al. (2003) simulated oxygen diffusion and consumption through a cover system with capillary barrier effects. The cover system comprised different configurations of silt tailings between two sand layers. The silt tailings layer was assumed to retain water under the prevailing conditions and therefore provide the resistance to oxygen ingress. Table 1 provides a summary of the geometry and properties of the various configurations that were considered by Mbonimpa et al. (2003). Specifically, Table 1 details the thickness, porosity, void ratio, dry density, degree of saturation, equivalent diffusion porosity, effective and bulk diffusion coefficients and the effective reaction rate coefficient.
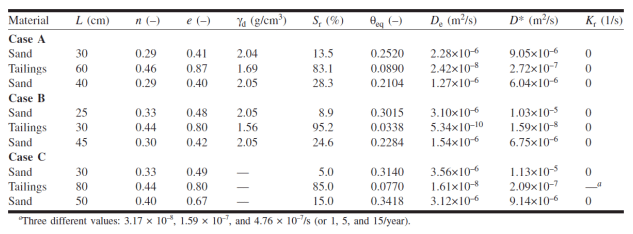
Table 1. Material characteristic defined for the three layer covers investigated by Mbonimpa et al. (2003).
SEEP/W and CTRAN/W were used to simulate scenarios similar to those of Case C, which includes consumption of oxygen within the tailings layer. A one-dimensional domain was created comprising a sand-tailings-sand sequence with thicknesses of 30 cm, 80 cm, and 50 cm, respectively. Mbonimpa et al. (2003) directly specified the volumetric water content of each layer, allowing the transport and consumption coefficients to be specified as constants. Only the tailings layer was considered. There are a number of techniques that can be used in SEEP/W to simulate predefined volumetric water content profiles; however, a more realistic approach to generating the water and air content profiles was used. In addition, the sand units were simulated. The approach was used to provide a basis for those wanting to model more advanced scenarios that give consideration to such processes as transient changes in the flow system and considerable spatial variability in water contents under various infiltration scenarios.
The pore-water pressure distribution was simulated using a steady-state analysis. A pore-water pressure head of -4.5 m was applied at the top of the domain and a unit gradient boundary condition at the bottom of the domain. These boundary conditions were selected to produce conditions similar to those modeled by Mbonimpa et al. (2003). The volumetric water content functions for a sand and silt were obtained from sample functions available in SEEP/W. Hydraulic conductivity functions were subsequently generated by the Fredlund & Xing estimation method available in SEEP/W. The sand and silt were assumed to have saturated conductivity values of 2.0E-5 m/s and 1.0E-07 m/s, respectively.
Equation 7 and Equation 8 were used to estimate the bulk coefficients of diffusion for oxygen transfer through the gas and dissolved phases. The calculations were done in a spreadsheet using the volumetric water content functions for the sand and silt and the resulting relationships were pasted into the corresponding data point functions. Figure 1 shows the bulk coefficient of diffusion through the gas phase versus the volumetric air content of the sand and silt. Figure 2 shows the bulk coefficient of diffusion through the dissolved phase versus the volumetric water content of the sand and silt.
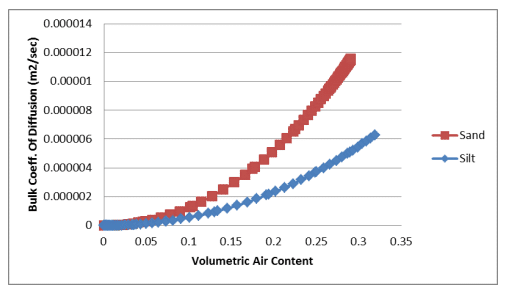
Figure 1. Bulk coefficient of diffusion through the gas phase versus volumetric air content for a sand and silt.
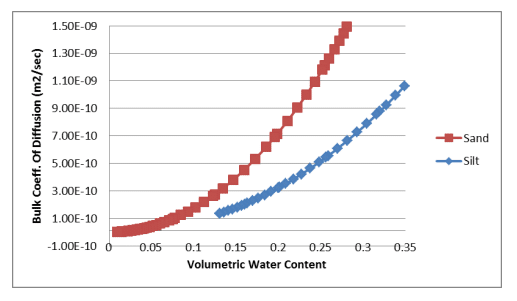
Figure 2. Bulk coefficient of diffusion through the dissolved phase versus volumetric water content for a sand and silt.
Henry’s dimensionless equilibrium constant is calculated as the ratio of concentration in the water phase to concentration in the air phase. Oxygen concentrations in water at 20 ℃ are approximately 0.032 times that of the concentration in the air; that is, . 𝐻 = 𝐶𝑤 𝐶𝑎≅0.032.
Simulations were completed using four values of the effective reaction rate coefficient for the 𝐾𝑟 tailings layer presented by Mbonimpa et al. (2003; Table 1): 0.0, 3.17E-08, 1.59E-07, and 4.76E-07 per second. Corresponding bulk reaction rate coefficients 𝐾∗𝑟 were calculated by dividing by an 𝐾𝑟 by an equivalent diffusion porosity of 0.076 to obtain 4.17E-07, 2.09E-06, and 6.26E-06 per second, respectively. As will be shown, the simulated equivalent diffusion porosity was spatially variable and not equal to 0.076; however, this simplification is adequate to explore the role of oxidation within the tailings layer at improving the effectiveness of the barrier system. In addition, it should be noted that the 𝐾𝑟 values are not equivalent to those used by Mbonimpa et al. (2003).
The oxygen concentration at the upper boundary was specified as 276.7 g/m3. Oxygen consumption in the mine waste beneath the base of the cover was assumed to maintain the oxygen concentration at 0.0 g/m3. Although this is not strictly correct, Mbonimpa et al. (2003) notes that this condition is the worst case scenario for evaluating the effectiveness of the oxygen barrier. Initial conditions for the transient CTRAN/W analyses were established using the material activation feature. The oxygen concentration was assumed to be 0.0 g/m3 in all materials.
All analyses simulated 40 days of oxygen transport and/or consumption. The analysis involving the non-reactive tailings was solved using 40 steps with exponential variability in the time increments. The analyses involving consumption were solved using 960 steps and a linear time step sequence. An exponential time step sequence was not used for the analyses involving consumption for reasons that are discussed subsequently.
Results and Discussion
Figure 3 shows a profile of the volumetric water content and corresponding equivalent diffusion porosity (Equation 2). The porosity of the silt is 0.45 and the average simulated volumetric water content was about 0.386, making the volumetric air content approximately 0.064. The simulated equivalent diffusion porosity (Equation 2) is therefore about , 𝜃𝑒𝑞 = 0.064 + 0.032(0.386) = 0.076 which is compares reasonably well to the constant of 0.077 specified by Mbonimpa et al. (2003).
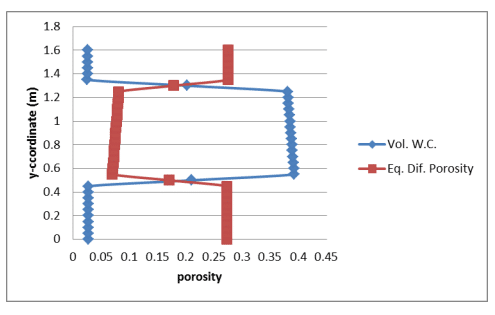
Figure 3. Profile of the simulated volumetric water content and corresponding equivalent diffusion porosity.
Figure 4 shows profiles of the bulk coefficient of diffusion in the gas and dissolved phases. In addition, the profile of effective coefficient of diffusion was calculated for comparison with Mbonimpa et al. (2003). The average effective diffusion coefficient through the silt material was about 1.5E-08 m2/s, which compares reasonably well with the constant of 1.61E-08 m2/s specified by Mbonimpa et al. (2003). An approximate two order of magnitude change in both and 𝐷∗ 𝑑(𝑎) 𝐷∗ 𝑑(𝑤) occurs between the sand and silt, with the gas and dissolved coefficients decreasing and increasing respectively. The magnitude of , however, remains about two orders of magnitude smaller 𝐷∗ 𝑑(𝑤) than and therefore does little to diminish the effectiveness of the oxygen barrier.
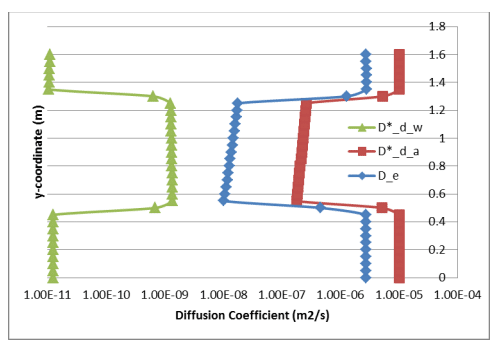
Figure 4. Profiles of the bulk diffusion coefficients through the gas and dissolved phases and the corresponding (single) effective diffusion coefficient.
Figure 5 shows the steady-state concentration profiles for non-reactive and highly reactive tailings scenarios. Top down consumption produces an ever decreasing mass of oxygen towards the bottom of the tailings, resulting in a bow in the steady-state concentration profile. A similar pattern is observed in the concentration profile of a system in which advection transport is in the opposite direction of the diffusion transport.
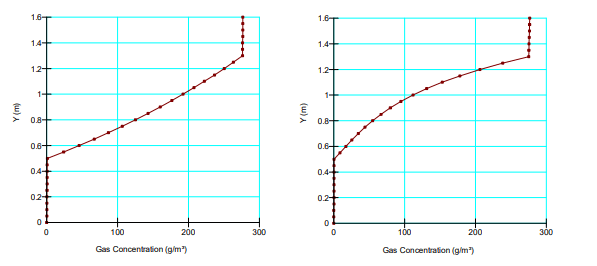
Figure 5. Comparison of the steady-state concentration profiles for non-reactive (left) and reactive tailings (right) with 𝐾∗𝑟 = 2.0E-06 per second.
Figure 6 shows a comparison between simulated oxygen fluxes at the base of the cover for the various scenarios. Figure 7 shows the fluxes obtained by Mbonimpa et al. (2003) using analytical and numerical solutions. The negligible differences between Figure 6 and Figure 7 are the result of the spatial variability in the bulk coefficient of diffusion and slight difference in the bulk reaction rate coefficient used in these simulations. Oxygen consumption in the tailings clearly reduces the oxygen flux past the base of the cover. Figure 8 shows the gas mass flux into the top and out of the bottom of the reactive tailings layer. Naturally the flux into the top of the cover increases as the tailings become more consumptive despite the decrease in the flux out of the bottom.
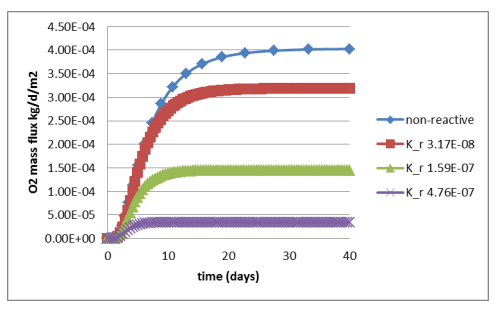
Figure 6. Time history of the oxygen flux at the base of the cover for varying magnitude of the bulk reaction rate coefficient.
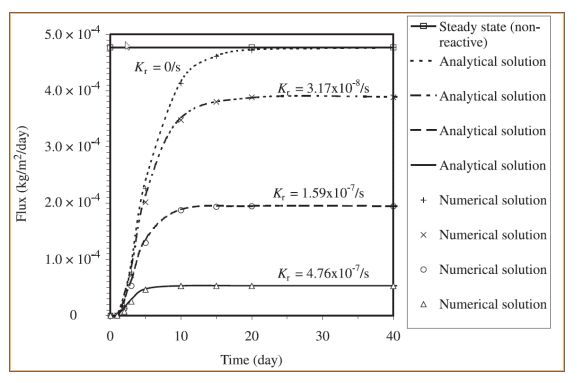
Figure 7. Numerical and analytical solutions of the oxygen flux from the base of the cover presented by Mbonimpa et al. (2003).
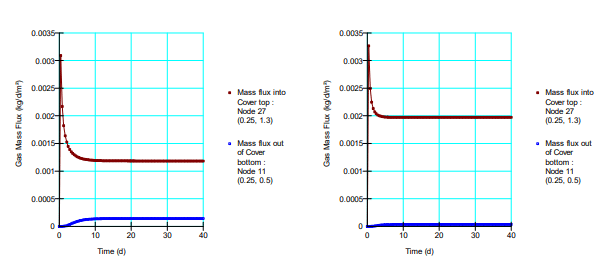
Figure 8. Gas mass flux entering and leaving the reactive tailings for 𝐾∗𝑟 = 2.0𝐸 ‒ 06 per second (left) and 𝐾∗𝑟 = 6.3𝐸 ‒ 06 per second (right).
As previously noted, exponential time sequences were not used for the analyses involving consumption. Subtle inaccuracies developed in the solution because the oxygen consumption rates (last term in Equation 5) were being multiplied by increasingly larger time increments. The consumption across the step had to be met by diffusion influx of oxygen, which produced subtle variations in the concentration profiles from time step to time step. The inaccuracies only became noticeable for the case involving the largest amount of oxygen consumption. Regardless, a linear time stepping sequence was used in all cases.
Summary and Conclusion
SEEP/W and CTRAN/W can be used to study the effectiveness of cover systems with capillary barrier effects at limiting oxygen ingress into sulphide bearing mine wastes. Cover systems of this nature rely on the presence of a layer that remains close to full saturation. Consideration can also be given to effectiveness of adding different quantities of reactive materials to the cover system. Often the greater challenge in designing these cover systems is ensuring saturation in the water retention layer when the cover is subjected to highly variable climate conditions. A SEEP/W analysis that makes use of a land-climate interaction boundary condition could be used to explore changing moisture conditions within the cover due to variable climate conditions.
References
Aachib, M., Mbonimpa, M., and Aubertin, A. 2004. Measurement and predication of the oxygen diffusion coefficient in unsaturated media, with applications to soil covers. Water, Air, and Soil Pollution, 156(1): 163-193.
Mbonimpa, M., Aubertin, M., Aachib, M., and Bussière, B., 2003. Diffusion and consumption of oxygen in unsaturated cover materials. Canadian Geotechnical Journal 40: 916-932.
Millington, R.J., and Quirk, P.J., 1960. Transport in porous media. In: F. A. V. Beren (Editor), Transactions of the 7th International Congress of Soil Science, Volume 1: Madison, WI, pp. 97-106.


