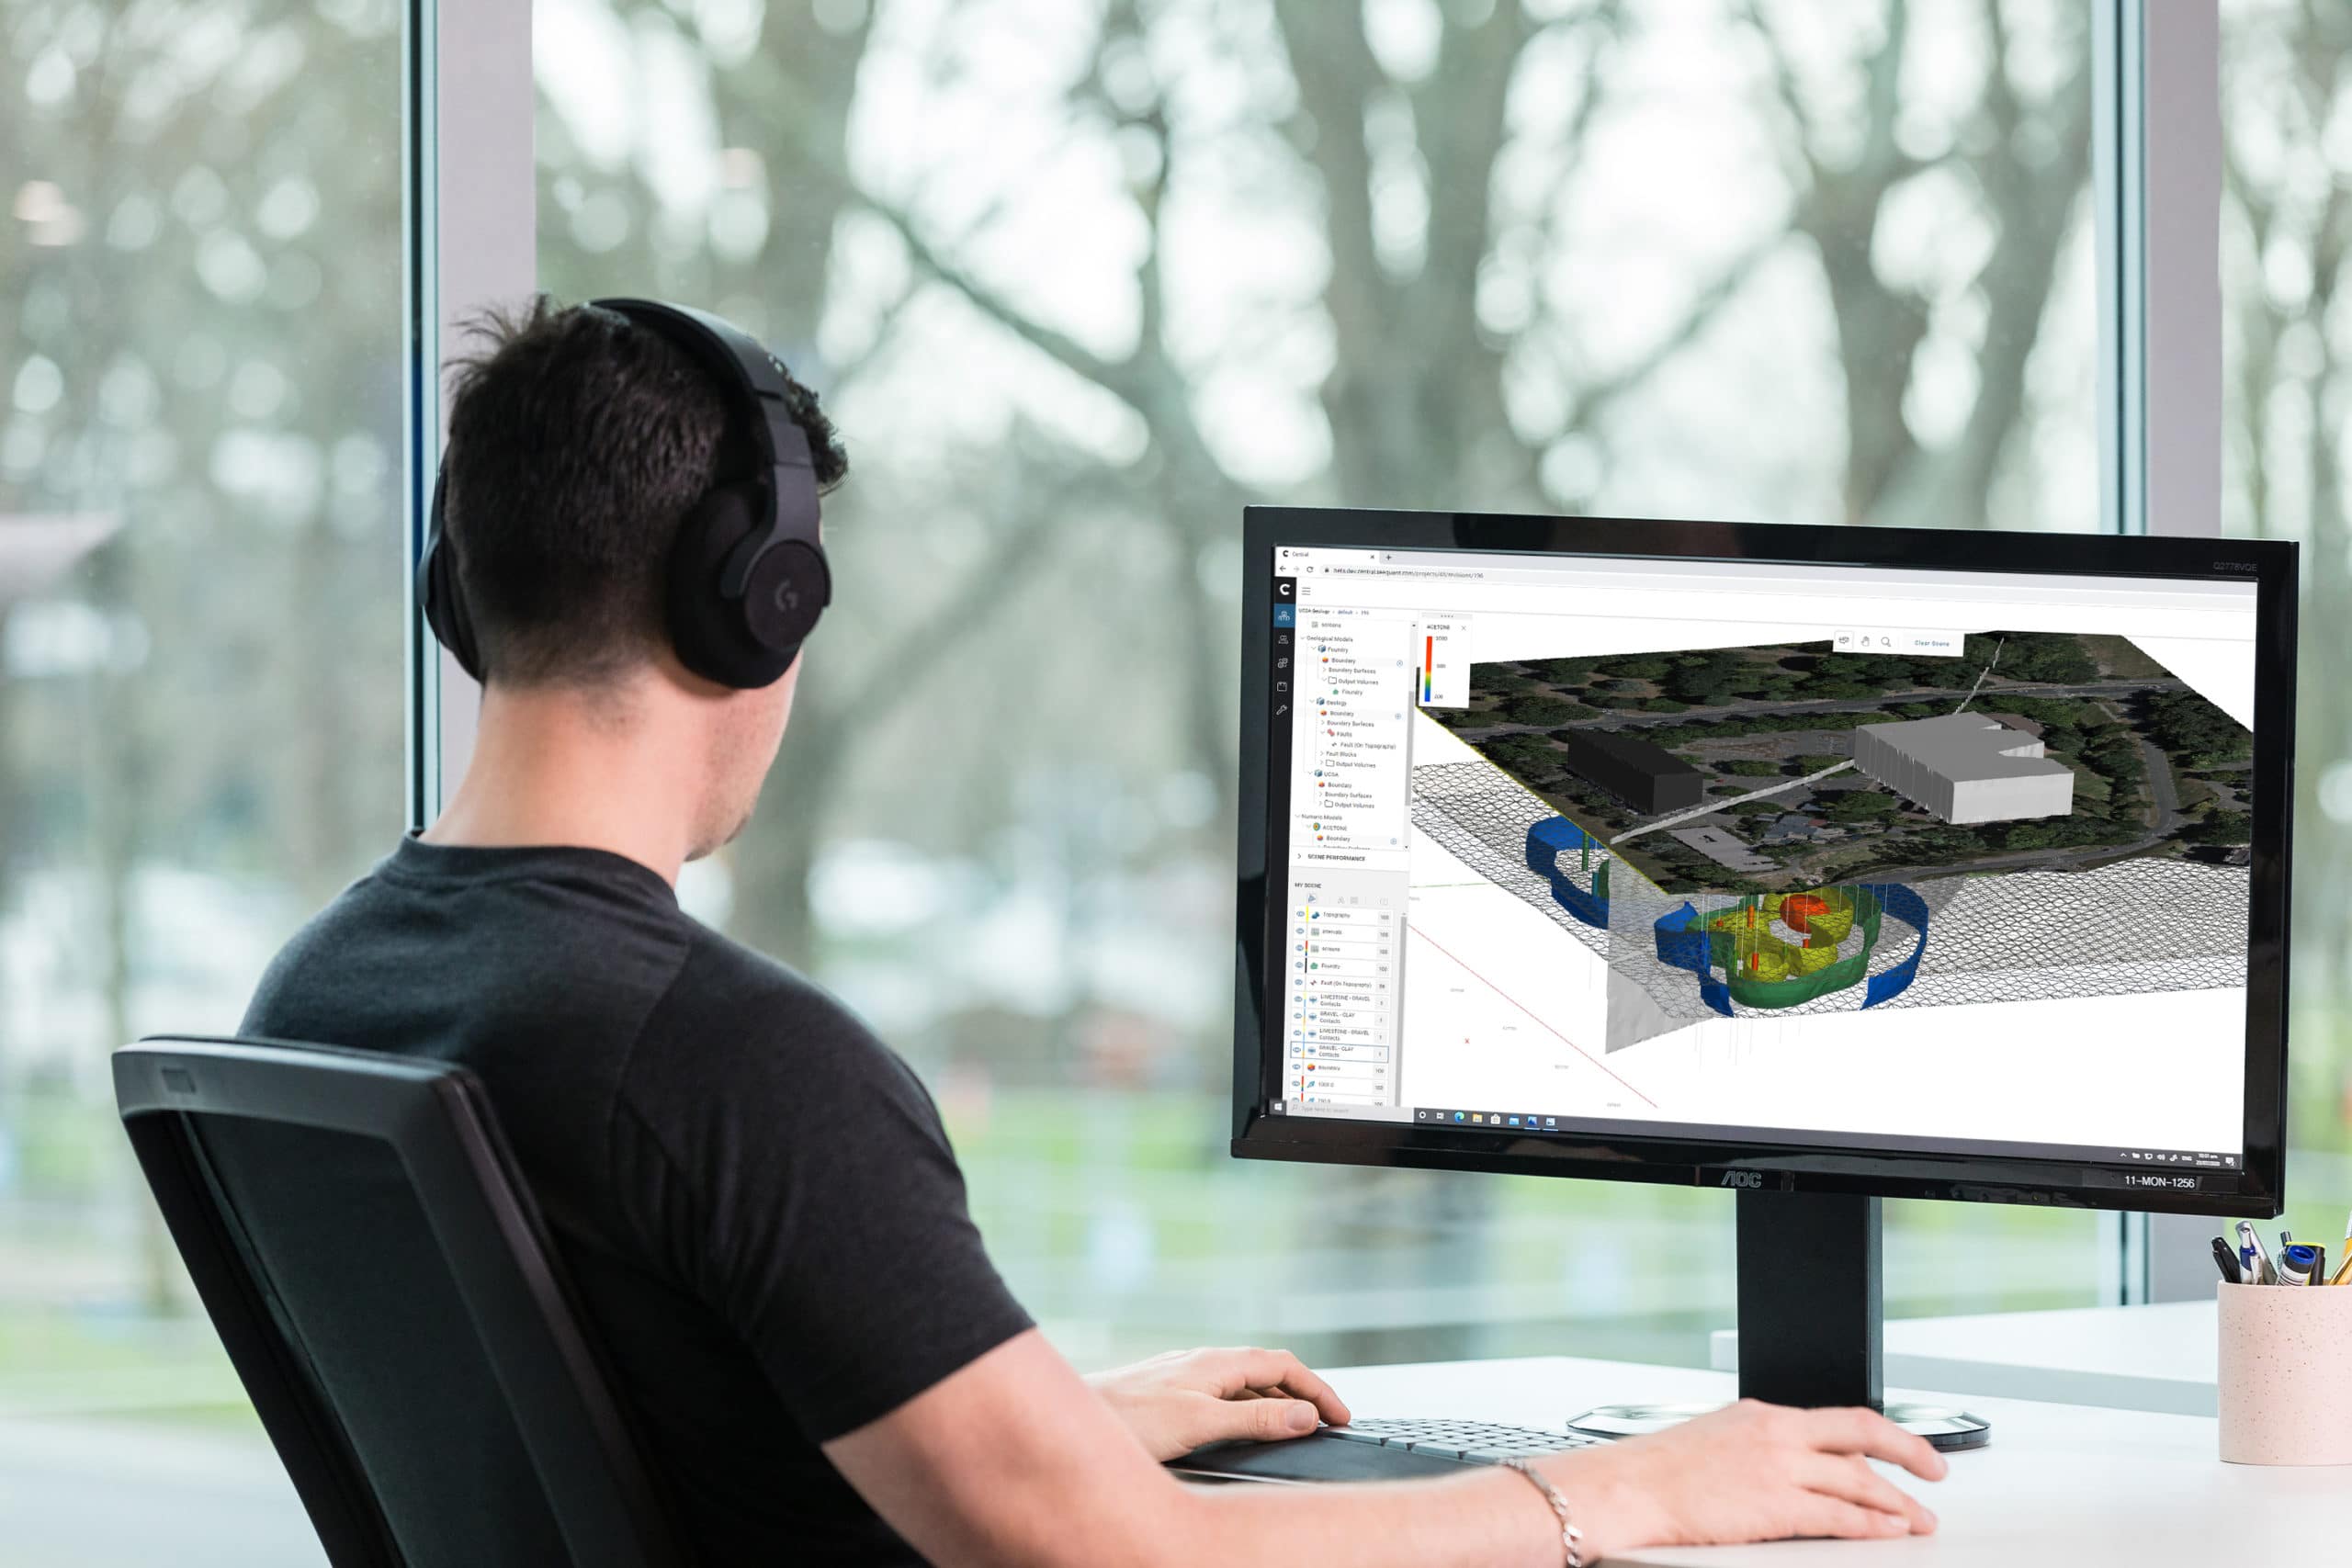
Web Visualisation takes sharing models to the next level. It steps us beyond Seequent’s previous visualisation tools and provides the capability to collaborate seamlessly in the Cloud.
This exciting new capability is enabled through Seequent Central, for all users across the Seequent ecosystem.
How does Web Visualisation work?
Web Visualisation is a new cloud capability which allows users to share and model with whoever they choose, directly in a web browser. This allows your teams to access all of your project data and history with no size limitations.
Web Visualisation is so simple, you can invite stakeholders with little or no technical experience to join the conversation. Simply share a link and the recipient can open a 3D scene which guides them directly to the crux of the conversation to start collaborating.
Whether it’s a question about a particular data point, or an area of uncertainty – you can guide collaborators directly to that spot in the model, and they can see the conversation, and contribute their unique understanding.
If you are a Leapfrog user, you will be very familiar with the interface, but even non-technical stakeholders will be able to intuitively navigate their way around the project – there’s no need to have experience in Central or Leapfrog.
See a quick demo of our new Web Visualisation capability in Central.

One of the key benefits of this new capability is how seamlessly you can involve and collaborate with stakeholders. They just need a Seequent ID and Central project permission. Detailed permissions and an event log ensure you have a clear understanding of who has access to what project and data.
Imagine how this can enhance weekly reporting, project reports and other collaboration. It another example of how we are working with you, to make your projects more accessible, shareable, and collaborative.
We are excited to start this new journey with you – as our Web Visualisation capability continues to evolve.
Try Web Visualisation today with a free trial of Seequent Central.


