In this blog we’ll explain how to use Leapfrog Geo’s Form Interpolant, a powerful illustrative tool for visualising structural data and identifying broad trends in 3D.
When preparing your drillhole data for modelling, many geologists are daunted by the initial steps of correlating their high-grade intercepts between drillholes and understanding their geological relationships.
Making sense of the relationships between high-grade intercepts in exploration drilling is made easier with the help of Leapfrog Geo’s Form Interpolant which gives the geologist more confidence that the patterns they are seeing are driven by geological reality.
So, what is this Form Interpolant we are so enthusiastic about? A Form Interpolant is an RBF Interpolant that uses planar structural data to control the RBF gradient and produce surfaces which represent predicted geological fabric orientation across the project area.
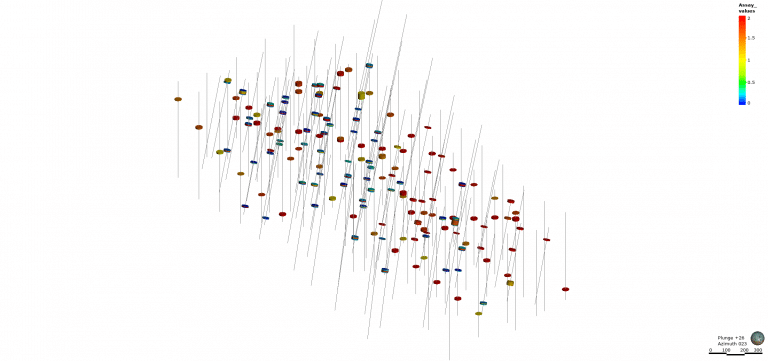
For this example, we will be looking at a shear-zone hosted gold mineralisation.
In the image below of our exploration program, our high-grade intercepts are identified in our drilling.
We can start making sense of the relationship between high-grade intercepts using a Form Interpolant.
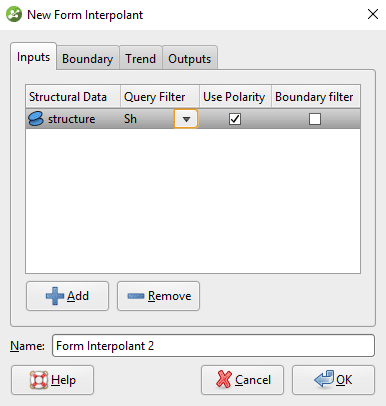
A Form Interpolant is created by, right-clicking on the Form Interpolants folder (in the Structural Modelling folder) and selecting New Form Interpolant. In the window that appears, click the ‘Add’ button to add structural data tables to the interpolant:
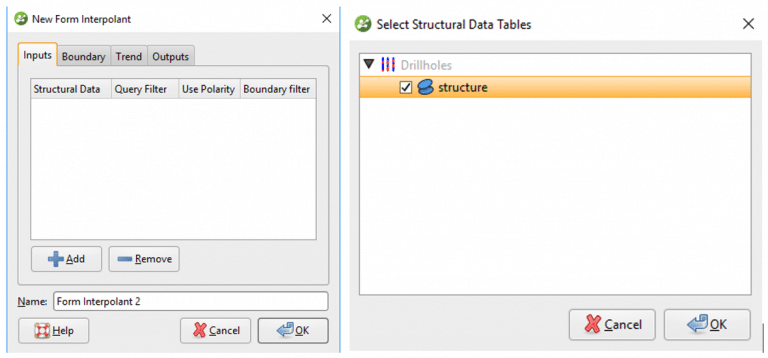
The structural data can consist of multiple datasets including surface mapping, televiewer data or logged structures from diamond core.
Filter the structural data using a query filter, that selects the structures controlling your mineralisation. In this case the logged shears have been identified:
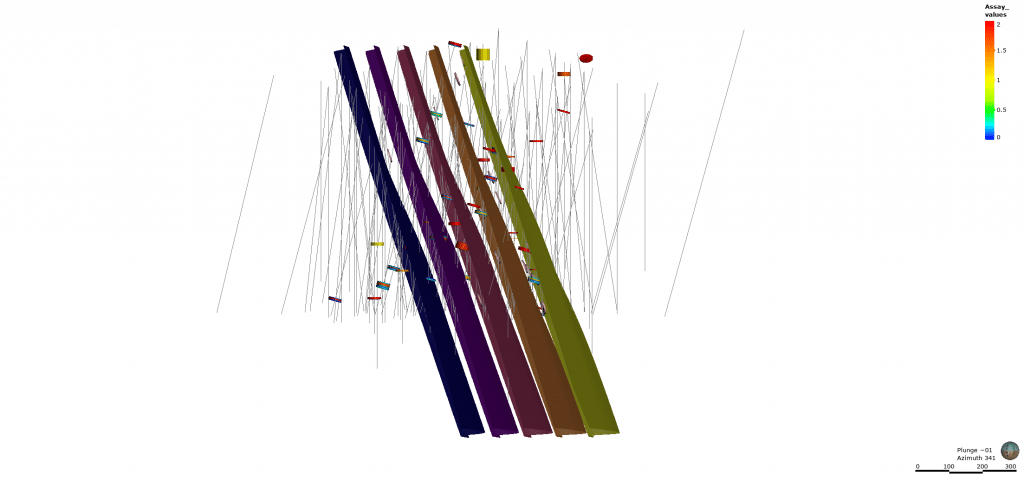
Form Interpolants are rapidly generated and can be reviewed against the drilling. The Form Interpolants display as a series of meshes that represent the 3D trend of the shears within the deposit; in other words, they show us how orientation is predicted to vary, without reference to a specific geological surface or interface.
Identifying high-grade intercepts that belong within the same lode is now easier. In this example, the high angle shears can be identified by following the Form Interpolant between drillholes. When commencing the interval selection, the geologist has more confidence that the correct intervals are being selected; providing clarity to complex data. Having greater clarity in your data at an earlier stage can generate huge time savings downstream.
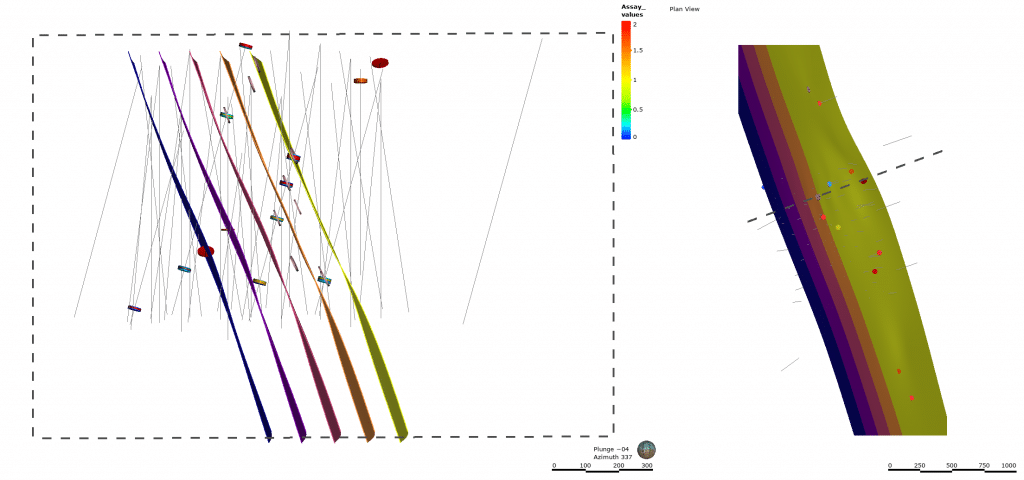
Not only is the Form Interpolant a great tool for assisting interval selection of your lodes, it can also be used for peer review. The most important part of a model’s peer review is checking that the outputs of your geological model align with the inputs of your data. By validating your mineralisation volumes against the Form Interpolants’, you can ensure that geologists in your team have a sound understanding of the controls on your mineralisation.
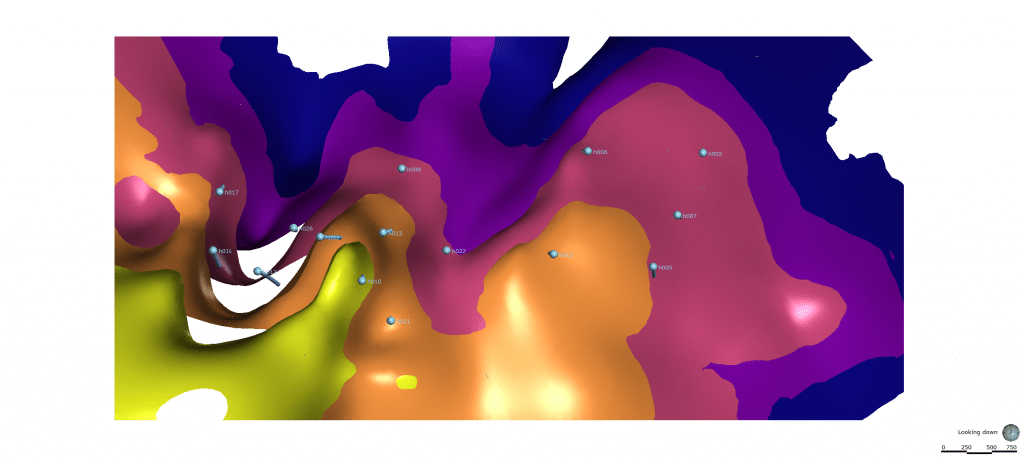
Another useful way to use Form Interpolants is to assist the drillhole planning process. Once you have completed your initial geological mapping campaign on your area of interest, the Form Interpolants will provide a visual representation of your potential sub surface structure. Reviewing the Form Interpolant can assist identification of key target drill areas for structurally controlled mineralisation.
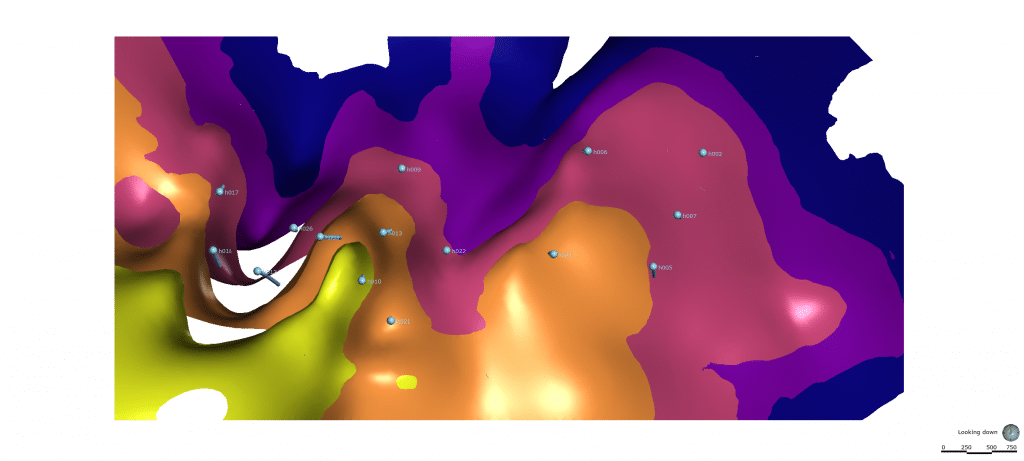
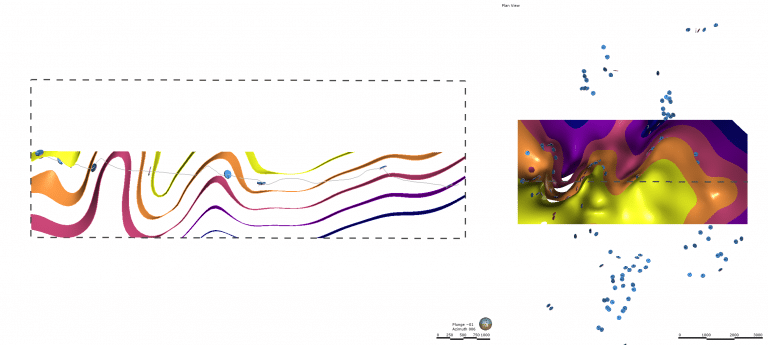
In this stratigraphic example below, mineralisation is predicted to be hosted within the more tightly folded anticlines and synclines of the western region. The Form Interpolant assists with identification of target areas and to plan a robust drill program.
Leapfrog Geo’s structural tools can help uncover valuable structural knowledge to improve your modelling workflows.


