Introduction
SEEP/W simulates water transfer in response to spatial variability in elastic and gravitational potential energies. Density-driven flow, also known as free-convection, can be simulated by giving consideration to spatial variations in fluid density. Fluid density affects the gravitational energy. Interpreting the results of a density dependent flow analysis can be challenging. For instance, the pore-fluid pressures and volume based fluid fluxes (L3/t/L2) in a vertical column with steady-state flow are both non-linear if the fluid density is variable. Fluid fluxes are generally assumed constant in the steady-state scenario; however, this assumption is only correct if the fluid density is constant.
The purpose of this example is to demonstrate how to interpret these seemingly contradictory results in the context of the mass conservation statement on which SEEP/W is formulated and the governing flow law for a variable density fluid in a porous medium.
Background
Water transfer finite element codes can be developed based on a flow equation written in terms of equivalent freshwater head. The governing equation is derived by calculating the pore-fluid pressure in the flow law from the expression for the equivalent freshwater total head ( hf):

where 𝜌0 is a reference density and 𝑢 is pore-fluid pressure. Figure 1 demonstrates the concept of freshwater head by showing the height (ℎ) to which water would rise in a standpipe installed within an artesian aquifer containing saline water. The pressure at points 1 and 2 are equivalent; therefore, the fluid would rise to a lower elevation if the standpipe was filled with denser saline water (subscript s) than it would if filled with lighter fresh water (subscript f). The equivalent freshwater head at both points 1 and 2 would be equivalent because the system is hydrostatic.
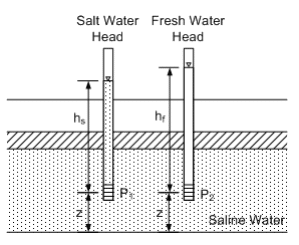
Figure 1. Pressure head in a standpipes with different fluids (Fetter, 1988).
A more generalized formulation can be developed by invoking Darcy’s Law for variable density fluid flow (Fetter, 1998; Frind, 1982a, b; Domenico and Schwartz, 1998):

where 𝜌𝑓 is fluid density, 𝑞𝑓 fluid flux, 𝑘𝑓 hydraulic conductivity, and 𝑔 is the gravitational acceleration. Notice that pore fluid density only affects the gravitational term. In this form, the fluid’s density may depend on pressure, concentration of dissolved matter, and temperature. SEEP/W Version 9 uses Equation 2 in the mass-based conservation law on which it is formulated. As such, SEEP/W can be used to simulate density-dependent free convection due to the effects of temperature or dissolved solutes.
The concept of equivalent freshwater head is redundant if a generalized formulation is used. In addition, the concept of total hydraulic head becomes erroneous when interpreting the results of density-dependent flow systems. Regardless, the concept of total hydraulic head is retained in the software because of the convenience of defining the primary unknown ( 𝑢𝑓 ) along boundaries that are in contact with free-standing fluid of constant concentration.
Numerical Simulation
The analyses in the associated GeoStudio example simulate the flow of a variable density fluid in a vertical and horizontal column. The project file contains two one-dimensional columns with a length of 1 m. One of the columns is horizontal while the other is vertical. The Coordinate System is two-dimensional, but the Analysis Dimension is one-dimensional.
Figure 2 presents the Analysis Tree for the GeoStudio Project and Figure 3 presents the Physics tab pertaining to both analyses. Solute and water transfer analyses are conducted on both analyses. The small + sign beside the CTRAN/W icon indicates that more than one physical process is being simulated on the domain. A solute transfer analysis cannot be completed without the results of a water transfer analysis because of the material property requirements. Moreover, free-convection is enabled on the water transfer analysis (i.e. density-dependent water transfer), so the analyses must be set to transient such that the water transfer formulation can get access to the solute concentrations on any time step. The duration of the analysis is arbitrary because the solute concentrations do not change throughout the analysis.

Figure 2. Analysis Tree for the GeoStudio Project.
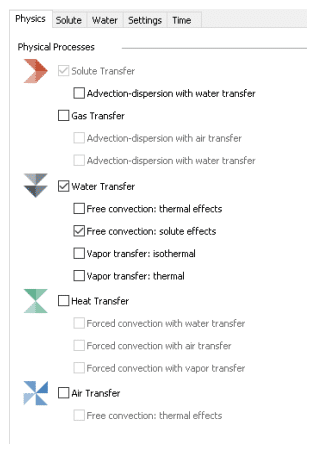
Figure 3. Physics tab for the CTRAN/W analyses.
The solute transfer analyses consider diffusion-only transport. Constant concentrations of 0.039 Mg/m3 and 0 Mg/m3 are applied to the top/bottom and left/right boundaries, respectively. The initial concentration conditions are established using spatial functions that match the boundary conditions. This produces a constant linear concentration profile across the domain, irrespective of the flow system, during the transient analysis. Given the isotropic, homogeneous, and steady-state nature of the problem, the solute transport material properties will not affect the CTRAN/W results. The hydraulic conductivity of the soil was arbitrary set to be 1e-06 m/s.
Selecting the option to include free convection due to solute effects necessitates the definition of a water density relationship. The water density verses concentration function is shown in Figure 4 and is selected on the Water tab. The density ranges from 1.0 Mg/m3 at zero concentration to 1.027
Mg/m3 at a concentration of 0.039 Mg/m3.
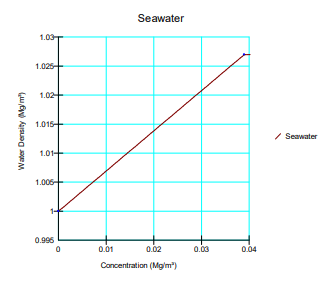
Figure 4. Water density verses concentration function.
The vertical column uses a total head boundary condition of 2 m and 1 m on the top and bottom, respectively. The horizontal column uses a total head of 2 m and 1 m on the left and right edges, respectively. The initial pore-water pressure condition in both analyses are establishing using a water table.
Results and Discussion
Vertical Column
Figure 5 and Figure 6 present the concentration and water density profiles for the vertical column, respectively. The concentration varies linearly as anticipated and the density varies in accordance with the concentration and specified function.
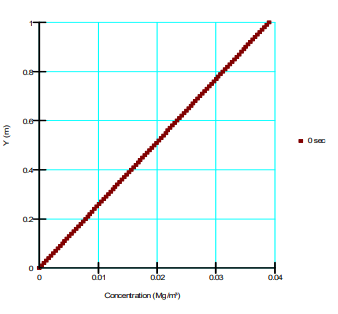
Figure 5. Concentration profile for the vertical column.
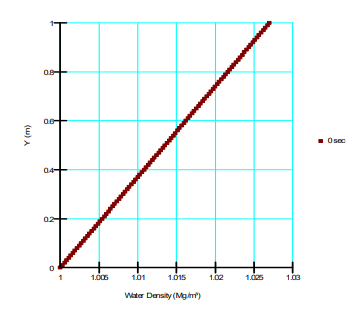
Figure 6. Water density profile for the vertical column.
Figure 7 presents the simulated non-linear pore-water pressure profile. Recall that the total head is 2 m at the top of the 1 m column. The pressure head is therefore 1 m and the pore-water pressure is equal to (1 𝑚)(1.027 𝑀𝑔/𝑚3) (9.807 𝑚/𝑠) = 10.072 𝑘𝑃𝑎 . The pore-water pressure at the bottom of the column is (1 𝑚)(1.0 𝑀𝑔/𝑚3) (9.807 𝑚/𝑠2) = 9.807 kPa.
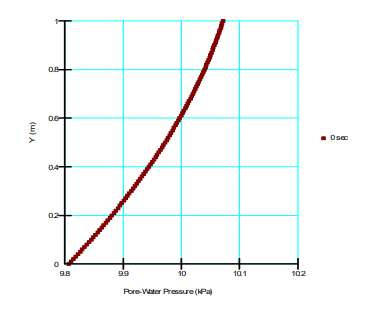
Figure 7. Pore-water pressure profile for the vertical column.
The pore-water pressure and density profiles were pasted into a spreadsheet and the individual gradients in the bracketed term of Equation 2 were calculated (Figure 8). Both gradients vary linearly through the column. The increase in the pore-water pressure gradient from top to bottom of the column is perfectly offset by the decrease in the gravity gradient; consequently, summation of the individual gradients produces a constant value of 10.205.
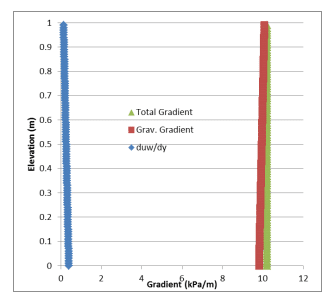
Figure 8. Gradient profiles for downwards flow.
Figure 9 presents the corresponding water (volume) flux (m3/sec/m2) as per Equation 2. The water flux varies through the column despite the bracketed term in Equation 2 being constant because the water density varies with depth. The water flux is greatest at the top of the column where the water
is most dense.
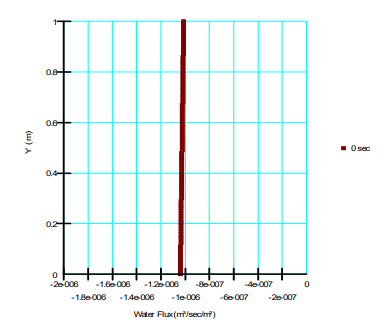
Figure 9. Water flux profile for the case of downwards flow.
As noted at the onset of this document, the results of a density-drive flow analysis need be interpreted in the context of the mass conservation statement and Darcy’s law for variable density fluid flow. Mass conservation requires that the mass fluxes, not the volume fluxes, be constant at steady-state. Multiplication of Equation 2 by fluid density gives:

where 𝑚𝑤 is the mass flux. The water density disappears from the denominator of the ratio leading the bracketed term, implying that the water mass flux will be constant if the energy gradient is constant (Figure 10).
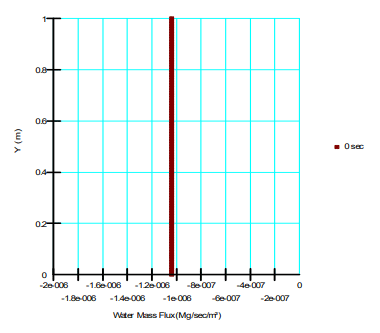
Figure 10. Water mass flux for the case of downwards flow.
Horizontal Column
Figure 11 and Figure 12 present the concentration and water density across the horizontal column. In-keeping with the vertical column, the concentration varies linearly as anticipated and the density varies in accordance with the concentration and specified function.
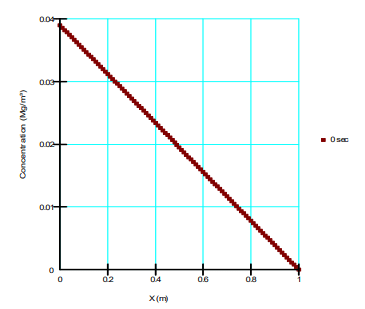
Figure 11. Concentration verses x-coordinate for the horizontal column.
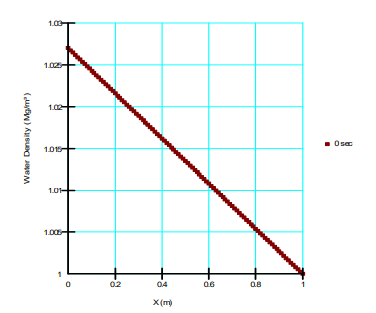
Figure 12. Water density verses x-coordinate for the horizontal column.
Figure 13 presents the pore-water pressure distribution for the case of horizontal flow. In contrast to the vertical column, the pore-water pressure gradient (𝑑𝑢 𝑑𝑥) is constant at -10.336. There is no spatial variability in elevation, making the gravitational gradient zero. As such, summation of the individual gradients once again produces a constant value equal to -10.336. The volume fluxes therefore vary across the domain (Figure 14) while the mass flux is constant (Figure 15). Mass conservation is again satisfied by the solution.
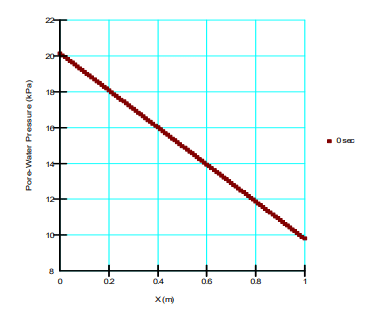
Figure 13. Pore-water pressure verses x-coordinate.
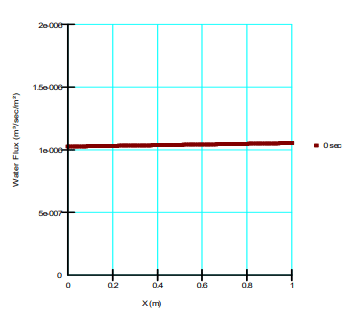
Figure 14. Water flux in the x-direction.
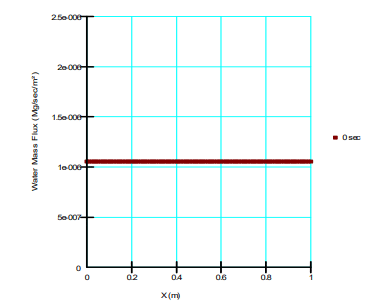
Figure 15. Water mass flux in the x-direction.
Summary and Conclusions
A one-dimensional density-dependent water transfer analysis involving flow through vertical and horizontal columns was completed. The results demonstrate that the spatial distribution of pore-water pressure and water flux must be interpreted in the context of Darcy’s Law for variable density fluid and mass conservation. In order for mass conservation to be satisfied, the pore-water pressure gradient and gravity term were offsetting such that the total energy gradient was constant. Under these conditions, the water mass flux will be constant throughout the domain (conservation of mass) despite spatial variability in the water (volume) flux.
It is also important to realize that the results cannot be interpreted in the context of total head or a gradient in total head. The total head boundary condition is retained because it is often convenient for defining the problem because concentration is generally constant along boundaries. Gradients of total head can be plotted and contoured in Results View, but these values should only be used as a guide to interpreting the flow system. As demonstrated in this example, the pressure gradient and gravity terms must both be given consideration.
References
Domenico, P.A., and Schwartz, W. 1998. Physical and Chemical Hydrogeology. 2nd Edition. John Wiley & Sons Inc., New York.
Fetter, 1994. Applied Hydrogeology, 3rd Edition. Prentice Hall, Englewood Cliffs, NJ.
Frind, 1982a. Simulation of long-term transient density-dependent transport in groundwater.
Advances in Water Resources, Vol. 5, pp. 73-88
Frind, 1982b. Seawater instruction in continuous coastal aquifer-aquitard systems. Advances in Water Resources, Vol. 5, pp89-97.
Senger, R.K., and Fogg, G. E. Stream functions and equivalent freshwater heads for modeling regional flow of variable-density groundwater; 1. Review of Theory and Verification. Water Resources Research, Vol. 26, No. 9, Pages 2089-2096.


