Introduction
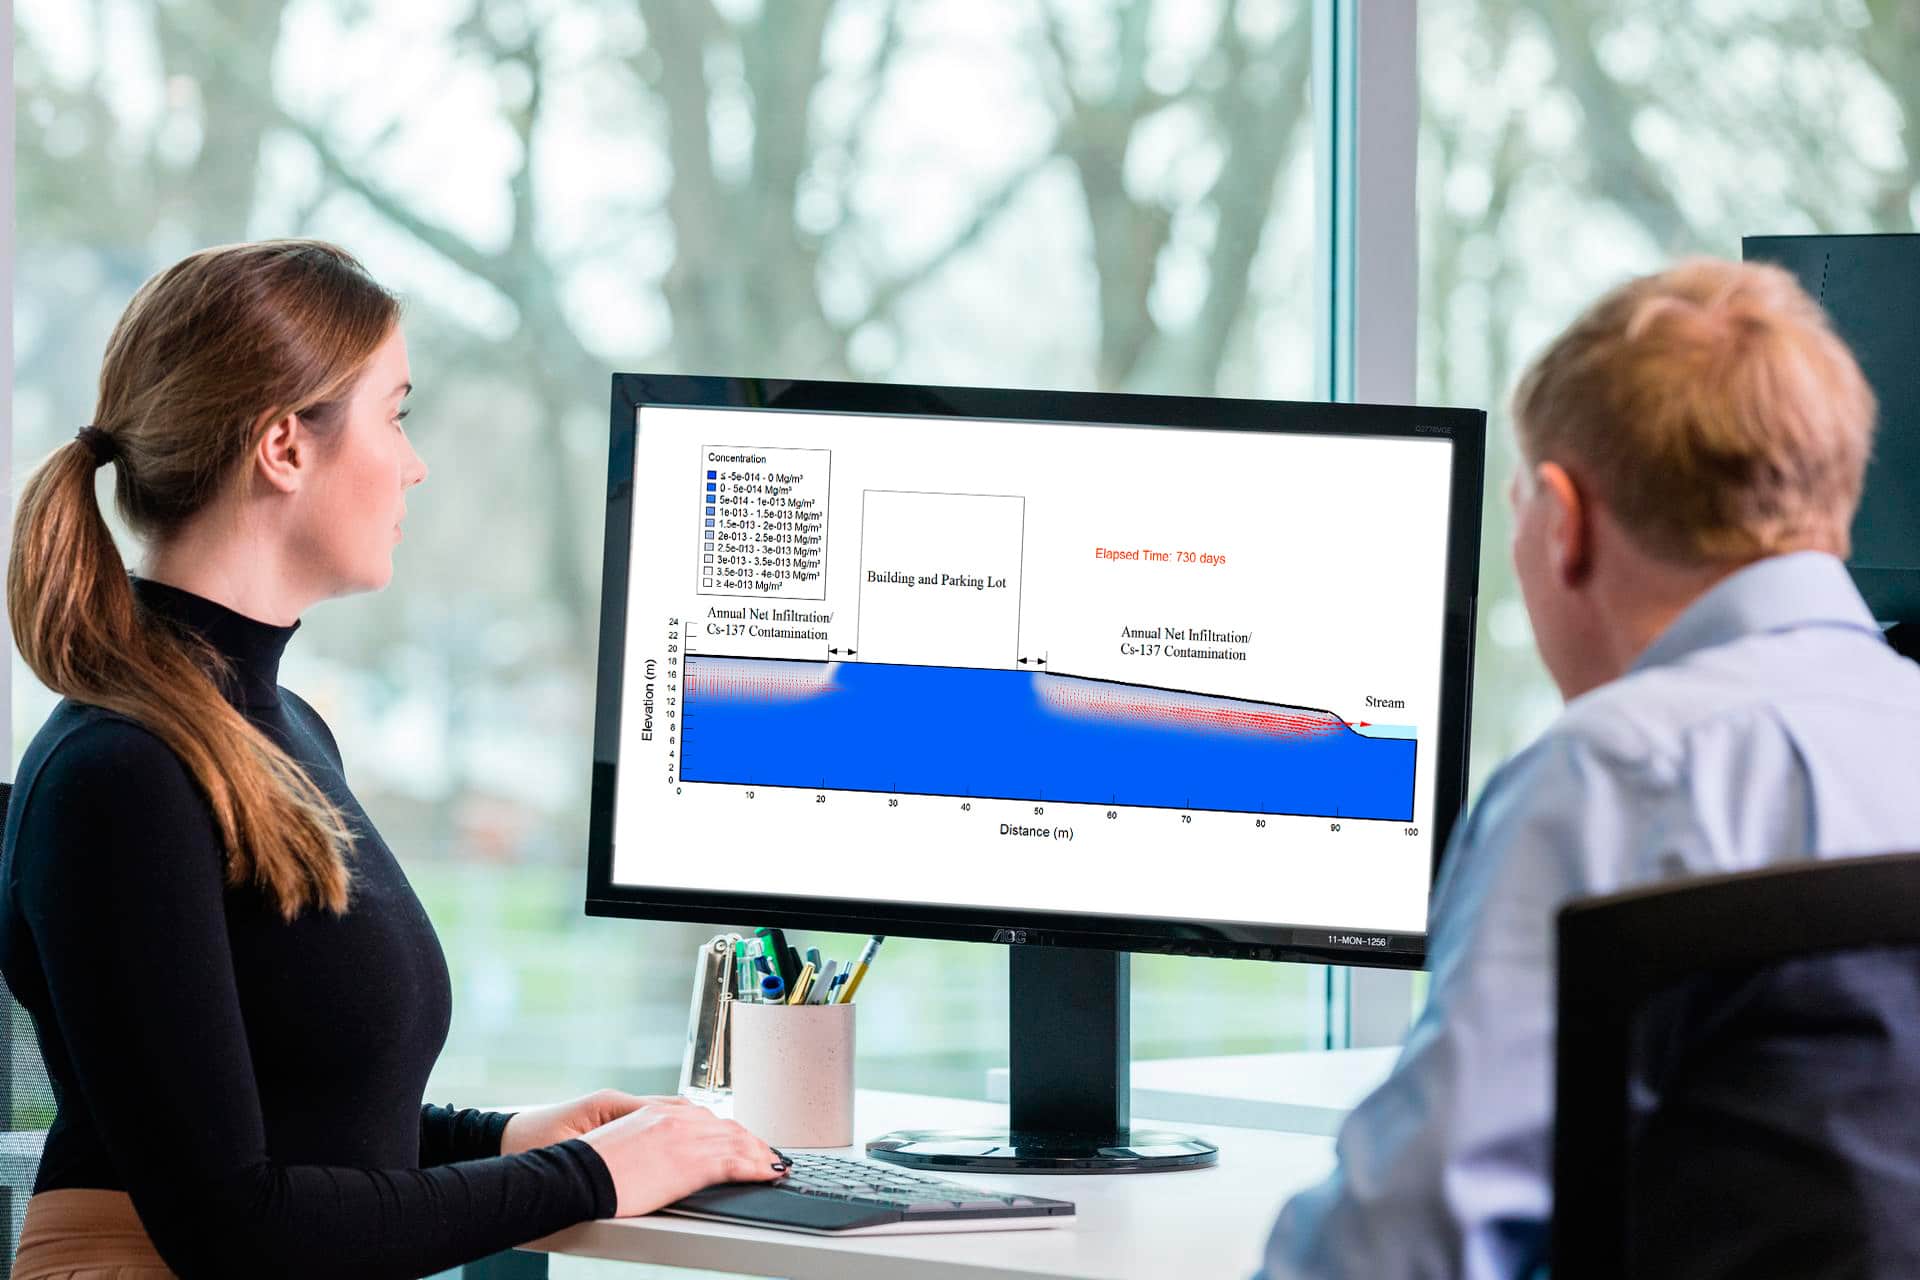
Caesium-137 is an anthropogenic radioactive isotope formed as a product of nuclear fission. Historically, Cs-137 was released into the environment by nuclear weapons testing circa 1950, while more recently nuclear accidents have been the primary source of release. The isotope settles out of the atmosphere onto the ground surface, where it can enter the groundwater flow system. The objective of this example is to analyze Cs-137 transport into an unconfined aquifer using CTRAN/W. The effect of adsorption and decay on solute concentrations and mass discharge is highlighted.
Numerical Experiment
Figure 1 presents the model geometry for the analysis. It is assumed that a building and parking lot covers a portion of the ground surface, which limits the area for infiltration and Cs-137 fallout. The aquifer is approximately 19 m thick at the left edge. The ground surface slopes towards the stream at the right.
The global element size for the domain is set to 0.5 m. Near the discharge location, the element size was set to be a factor of two greater than the global element size (Figure 1) in order to satisfy the Courant Number for the given time step size and groundwater velocity in this area. A surface region with a thickness of 0.25 m was drawn across the upland recharge area (Figure 2). Surface regions are a convenient approach for creating thin surficial layers with vertically aligned nodes.
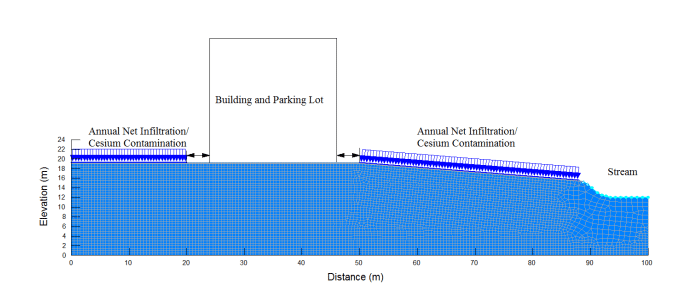
Figure 1. Model domain and mesh discretization.
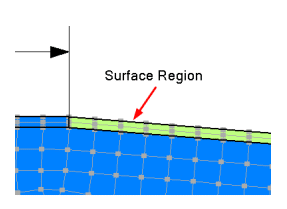
Figure 2. Surface region detail.
Three analyses have been created in the GeoStudio Project: a steady-state SEEP/W analysis and two advection-dispersion CTRAN/W analyses (Figure 3). The seepage analysis is used to establish the groundwater velocities and water contents required for the transport analyses. It is therefore set as the Parent, which is indicated by the relative position in the Analysis Tree. Two transport cases were considered: 1) no adsorption and no decay; and, 2) adsorption and decay included. The goal is to highlight the effect of decay and adsorption on contaminant transport in the system. Both transport analyses include advection-dispersion, which is selected on the Physics tab.
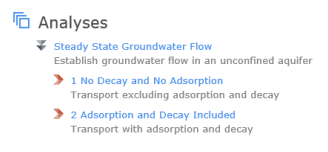
Figure 3. Analysis tree for the GeoStudio Project.
The estimation functionality was used to develop hydraulic conductivity and volumetric water content functions for a silty-sand in the SEEP/W analysis. The transport properties for both cases included the following: a coefficient of molecular diffusion which varied from 2.5×10⁻⁵ m2/day at saturation to 2.5×10⁻⁶ m2/day at a residual water content of 0.03; and a longitudinal and transverse dispersion of 2 m and 0.2 m, respectively. A number of additional transport properties were used for Case 2 including: a decay half-life for Cs of 30 years (10,950 days), a dry density of 1500 kg/m3, and a partitioning coefficient (𝐾𝑑 ) of 1.4×10⁻⁷ m3/g.
The annual groundwater recharge to the unconfined aquifer was assumed to be 200 mm/year. This flux rate (9.49×10⁻⁹ m/sec) was applied to the ground surface of the SEEP/W analysis outside the footprint of the parking lot. The stream was modeled using a total head boundary condition equal to 14 m with a potential seepage face along the stream bank. The remaining edges were assumed to be no-flow.
Initial conditions for the CTRAN/W analyses were established using the material activation feature. The activation feature allows each node within a region to be assigned an initial concentration at the onset of the analysis. The use of this feature facilitates the specification of an initial mass of Cs-137 within the rooting zone, which then is allowed to leach over time as it is flushed by recharging water.
For this example, the average Cs-137 fallout on the ground surface is assumed to be 3.7×10⁻⁷ g/m2. It is also assumed that the fallout Cs-137 has equilibrated with the pore-water in the top 0.25 m of soil, which has a volumetric water content of 0.21 (discussed below). The initial concentration of Cs-137 for Case 1 is then calculated from the following equation:
𝑀𝑐𝑠 = 𝐶𝑜𝑉𝑤
where 𝑀𝑐𝑠 is the mass of the contaminant, 𝐶𝑜 is the initial concentration, and 𝑉𝑤 is the volume of water. Accordingly, the initial concentration is calculated as 7.05×10⁻⁶ g/m3 because the volume of water in 1m2 of soil is 1 m × 1 m × 0.25 m × 0.21 = 0.0525 m3.
In Case 2 the fallout Cs-137 will be adsorbed to the soil solids as well as being present in the pore-water. The initial concentration is therefore calculated from the following equation:
𝑀𝑐𝑠 = 𝐶𝑜𝑉𝑤 + 𝐾𝑑𝐶𝑜𝑀𝑠
where 𝐾𝑑 is the distribution coefficient and 𝑀𝑠 is the mass of soil. The mass of soil in the upper 0.25 m is calculated as 375 kg per m2 using the dry density listed above. The initial concentration is calculated as 3.52×10⁻⁶ g/m3 for an assumed of 1.4×10⁻⁷ m3/g. 𝐾𝑑
As noted above, the initial concentrations are established using the activation feature. Note that there are four materials in the file: two that include the activation concentrations calculated for Case 1 and 2, and two that have an activation concentration of 0 g/m3. The materials with the non-zero activation concentration are applied to the surface regions outside the footprint of the parking lot for Cases 1 and 2 (Figure 4), while the materials activated at zero concentration are used for all other regions.
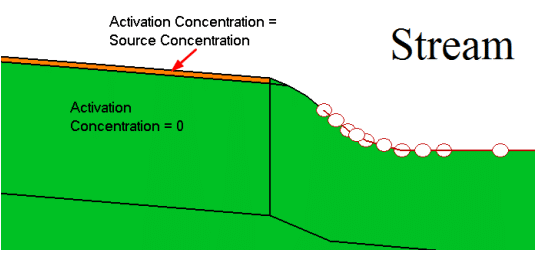
Figure 4. Regions activated with source concentration and zero concentration.
The CTRAN/W boundaries are set to zero mass flow (i.e. no boundary condition is applied), except at the stream. It is assumed that the flow of fresh water in the stream maintains a zero concentration condition. The bank of the slope is assigned a free exit mass flux condition, which will allow mass to exit at this boundary with the flowing water.
Both transport analyses were solved for a time period of 60 years using 480 steps and a linear time series. The number of time steps was chosen to ensure a time step size small enough to satisfy the Courant number for the given mesh size. The mesh size was designed based on the Peclet number (see CTRAN/W Engineering Book). It should be noted that the number of saved time steps was minimized in the example (GSZ) to reduce the file size.
Results and Discussion
SEEP/W Results
Figure 5 presents the total head contours for the steady-state seepage analysis. Water infiltrates at the ground surface outside the footprint of the parking lot and travels vertically downward toward the water table. The water then travels laterally, primarily in the saturated zone, and discharges to the stream.
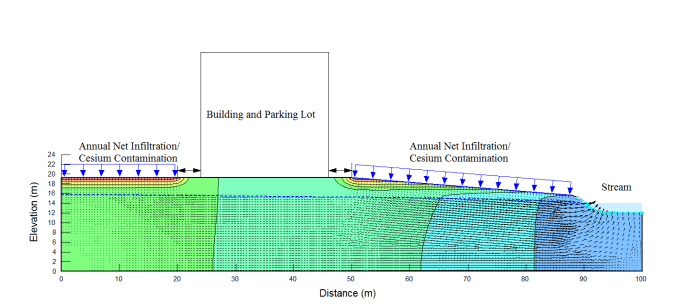
Figure 5. Total head contours, flow vectors, and water table.
Figure 6 presents the volumetric water content (VWC) profile along the left edge of the SEEP/W domain. The average VWC in the top 0.25 m is approximately 0.21, as was used to calculate the initial concentrations for Case 1 and 2 above. Another volumetric water content profile is included in the file at an x-coordinate of 75 m. The VWC is slightly higher at this location because of the sloping ground and proximity to the water table, which means that the matric suctions are lower. Regardless, a VWC of 0.21 was a reasonable value to calculate the initial concentrations.

Figure 6. Volumetric water content profile along left edge.
CTRAN/W Results
Figure 7 and Figure 8 present concentration contours for Case 1 after 4 years and 30 years, respectively. The white shading represents areas of high concentration while dark blue is fresh pore-water. Contaminant transport occurs vertically downward from the source and then spreads laterally with the flowing groundwater. After 4 years, the right-most plume has reached the stream while the left-plume continues to spread laterally underneath the building. Note that the upper 0.25 m of soil is nearly flushed of the contaminant.

Figure 7. Case 1 concentration contours after four years.

Figure 8. Case 1 concentration after 30 years.
After 30 years, the right-plume is almost entirely flushed from the system (Figure 8). The left-plume has spread beneath the building and parking lot and down into the left corner of the domain, where groundwater flow rates are much lower (see flow arrows in Figure 5). The contours also demonstrate the effect of upwards diffusion into the stagnant groundwater flow field beneath the building. Note that the contours tighten up in this area as there is no vertical component of advection and the low water contents limit upward diffusion of the contaminant.
Figure 9 and Figure 10 present the evolution of concentration with time at two locations ({x,y} positions {10,60}, right of building; and {10,95}, near the stream) for both Case 1 and 2. There are two peaks observed at these locations: the first is associated with the contaminant source located right of the building and the second is due to the source located left of the building. The maximum concentration in Case 1 does not reach the initial source value because the plume has become dispersed, while in Case 2 the effect of decay has significantly diminished the peak concentration.

Figure 9. Concentration verses time at a coordinate of {60 m, 10 m}.

The effect of adsorption and decay is manifest in two ways: 1) the arrival time of the peak concentration is delayed at all locations; and, 2) the value of the peak concentration is diminished. Figure 10 in particular shows the delayed arrival time of the peak concentration for the first plume, which occurs at year 23 for Case 1 and year 32 for Case 2. Adsorption also causes a smearing effect as shown by the post-peak concentrations: the curves are more spread-out for Case 2 as Cs-137 is more slowly released from the adsorption sites over time.
Figure 11presents the cumulative mass discharge into the stream for Cases 1 and 2. The total mass entering the stream is greater for case 1 than case 2 because of the effect of radioactive decay in Case 2. Moreover, the effect of adsorption is again demonstrated as the rate of mass discharge is greater for Case 1 between 0 and 30 years.

Figure 11. Cumulative mass discharge into the stream for Case 1 and 2.
Concluding Remarks
CTRAN/W and SEEP/W are used to model advective-dispersive transport of the radioactive isotope Caesium-137. It was assumed that the Cs-137 fallout at the ground surface had equilibrated with the pore-water in the top 0.25 m of soil. This creates a finite source of contaminant that is transported via the groundwater flow system. The analysis demonstrates the relative influence of adsorption and decay, which acts to delay the arrival time of the peak concentration, smear the concentration verses time plots, and diminish the mass in the system.


