To stay innovative, Seequent constantly strives to understand the next generation of technology tools and ways of working. We collaborate with and support research groups, academic institutions and industry organisations to learn about creative approaches to the challenges our users face. In addition, Seequent is a proponent of open standards (such as the Open Mining Format), and the role open source software has in advancing innovation, and driving change in commercial products.
One of the research groups we support is the Frontier Observatory for Research in Geothermal Energy (FORGE) project at the University of Utah. This project aims to provide research on enhanced geothermal systems (learn more here). This year, FORGE held a student Geothermal Design Challenge, asking students to “research data, interpret information and create a data visualization portfolio that will tell a compelling story about geothermal energy.”
One of the winners was Bane Sullivan – a geoscience visualisation developer, geophysics researcher and Master’s student at the Colorado School of Mines. Bane’s team won for their project titled ‘Open Source Solutions for 3D Communication’. Their project used available open-source software, including SimPEG (developed in part by Seequent’s Director of Cloud Architecture, Rowan Cockett) and the Open Mining Format (which we are also supporting).
We wanted to learn more about Bane’s creative approach to geo-vis, so we sat down with him to learn more.
Our interview with Bane Sullivan

How did you realise there was a need to bring 3d visualisation into the Geosciences?
It all started when I was in my undergraduate program at the Colorado School of Mines where I received a degree in geophysics and minored in Computer Science. I was in courses where we are dealing with spatially referenced data, 3D data and sometimes 4D data, and we had no tools to visualise that data. So I started developing scripts to make 3D visualisations of things we [the students] were doing in projects.
Why did you personally decide to take this challenge on?
I’ve always enjoyed programming, developing software and creating tools that make my life and other people’s lives easier. I have this domain knowledge in geophysics, and I really enjoy seeing geophysics in 3D – it helps me understand it and I think it helps a lot of other people understand it as well. This inspired me to make visualisation tools that were useful to other scientists and researchers, so that I could enable them to do the research they’re most excited about.
You initially started off by developing tools to bring Geophysical data into virtual reality. But then you realised there was a missing link, so you created Pyvista – Can you tell us about that?
As I became more involved in geoscience visualisation, I wanted to figure out how to do 3D visualisation in Python. Because that’s where a lot of geoscientists are working today, and there’s a plethora of Python geoscience processing libraries out there already – while not many researchers were interested in virtual reality. I wanted to make a tool that provided a ‘glue’ between all these available open source libraries – for 3D visualisation, mesh analysis, etc. So that’s why started developing PyVista, formerly called vtki.
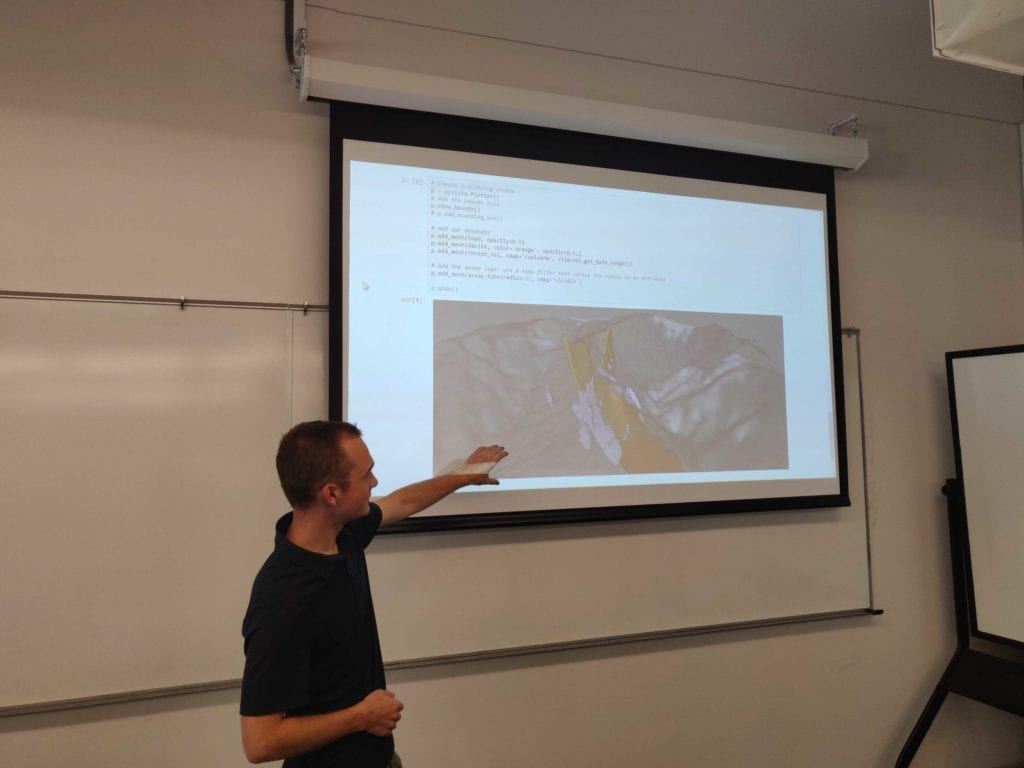
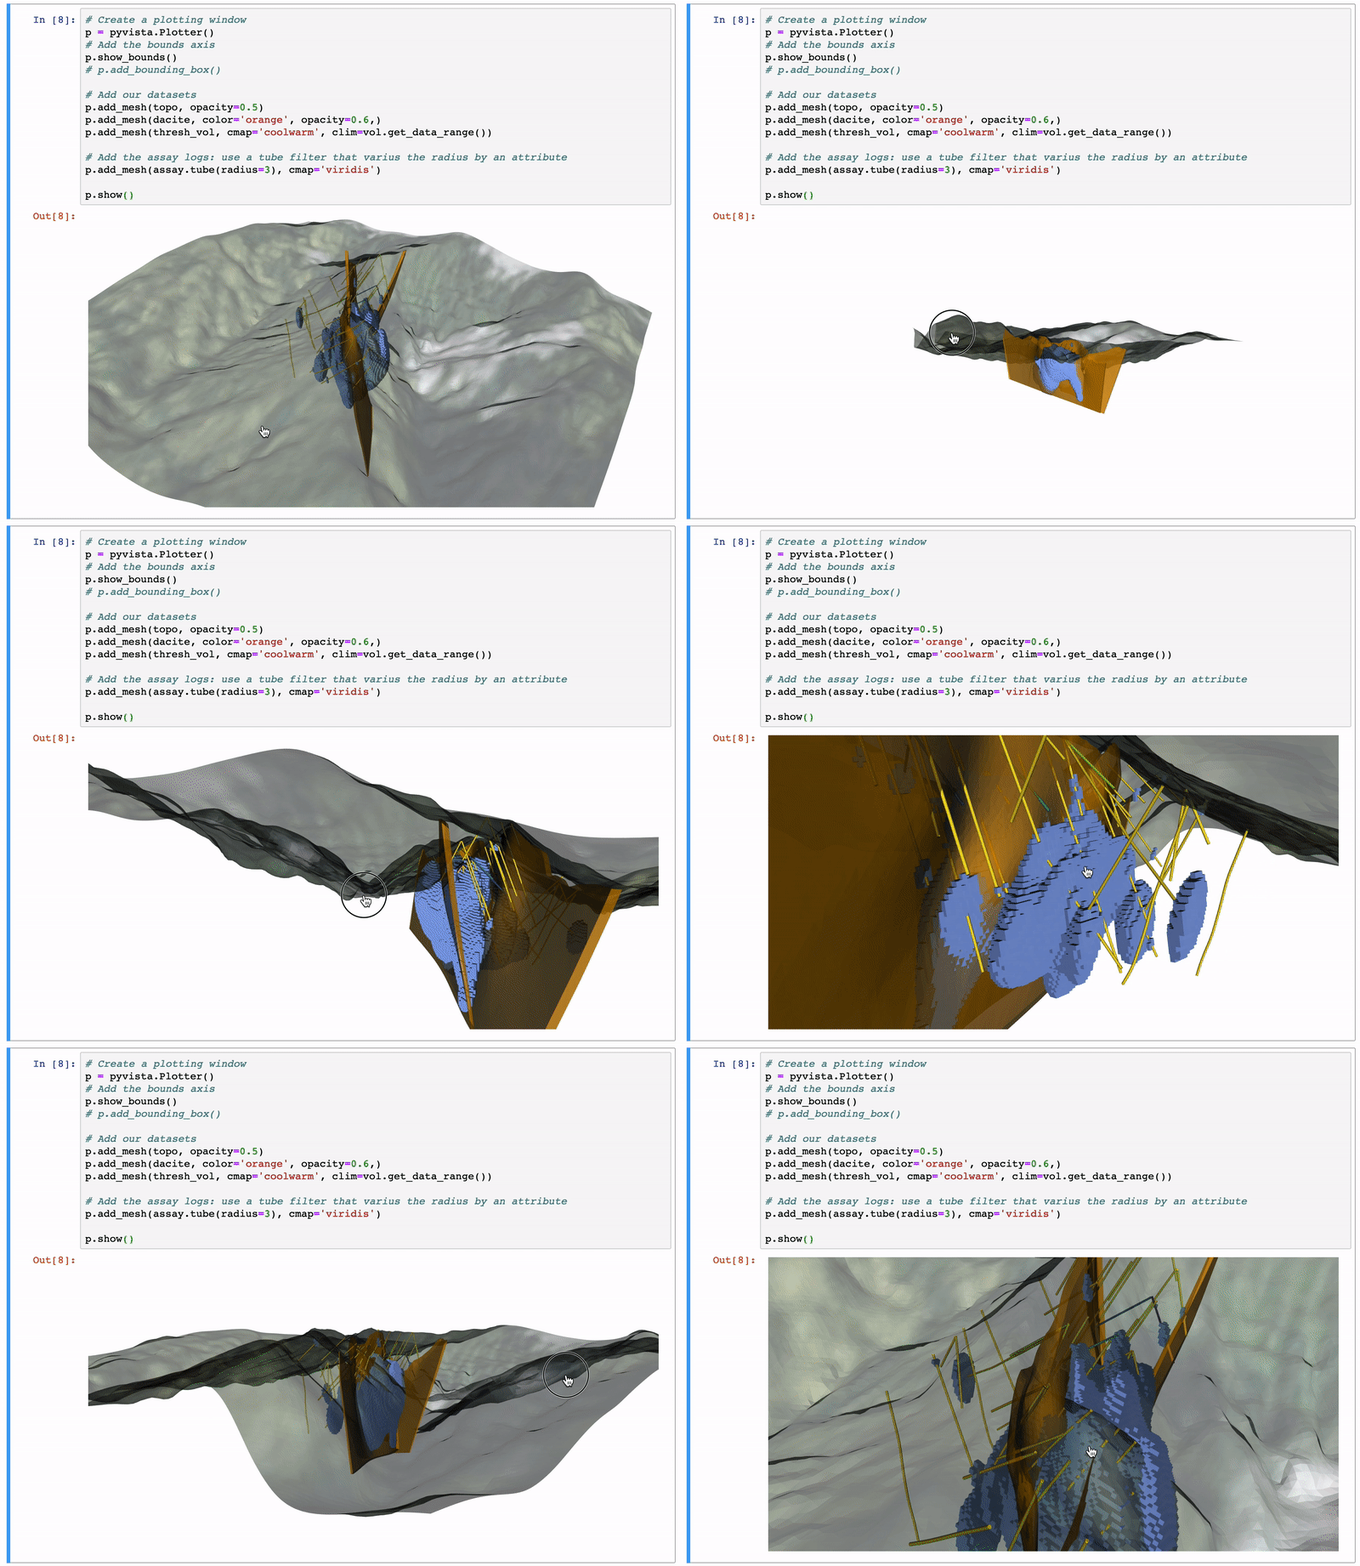
PyVista is a pure Python 3D visualisation and mesh analysis library. It has explicit mesh and volume types where you can hold your spatially referenced data – and then you can do analysis filtering, data transformations and 3D visualisation. I’ve also created PVGeo, which is a plug-in package to help connect geoscience libraries to PyVista and the VTK realm of data visualization.
So now PyVista is a common underlying framework that levels the playing field for all these libraries. It’s now easy for a researcher to do geophysical inversions in SimPEG, and then do geological modelling in GemPy, for example. Then they can integrate their results with a 3D visualization tool, PyVista – it’s been a powerful way for people to communicate their findings, and work across sub-disciplines in geoscience.
Why do you think it’s important to communicate geoscience findings?

If there’s a project going on, external stakeholders are usually just as involved as the scientists. It’s really important for them to understand what the scientists are saying and why they’re saying it. For example, why you’d want to build a mine on that side of the mountain, and not the other. It’s also really important for communities to be able to see the data – not just have scientists ‘talk at them’. Instead of telling them, ‘the data says this’, they can show them the data. Communication through mediums like 3D visualisation helps foster understanding and trust between different groups.
Why did you decide to participate in the Forge geothermal design challenge?
It was a good opportunity for me to showcase our work. Even if we didn’t win, it was an opportunity for me to take data from one project and generate a few 3D visualisations using PyVista. And then be able to share, demo those, and say, “this is what the software can do.”
The title for your project is “Open-Source approach to 3-d communication”. Why did you pick this theme?
Everything I used in the project is open source or openly accessible. This enables anyone to come download the code, download the project, download the data files and reproduce it themselves. It helps provide trust.
There are so many open tools out there. I used, for example, SimPEG, SGeMs, ParaView and the Open Mining Format. These tools enabled me to work across different domains and bring everything together.

I see a clear path to integrate everything into one standard or format – which is why I focused so much on the Open Mining Format. The Open Mining Format allowed me to go from things like PyVista and PVGeo, to ParaView, SGeMs, SimPEG, and GemPy. It’s been a nice vehicle to bring everything in, to live laterally across all these software platforms.
On your website, it says you’re excited about building the next generation of geoscience visualisation technology. What does that ideal future state look like to you?
I’ve been thinking about this a lot lately. I think the next generation of geoscience visualisation technology is accessible – it’s open source. That way anyone can contribute code and anyone can use it. That allows, for example, students at a research institution to focus on their research, and not the complicated nuances of visualisation and processing their data. It’s making it easy for people to rapidly explore their data, communicate findings and facilitate reproducibility.
Imagine if you saw an academic paper published that had complicated physics – then imagine that anyone could check out the data, reproduce those findings and interact with 3D visualisations of those results. That’s what I think is next.
You’ve mentioned the word reproducibility a few times. Why do you think reproducibility is so important?
It keeps us honest. It’s a common theme across science right now and is partially why all these open source libraries are popping up. Because if we’re publishing work on some cutting-edge research in geophysics, it helps further science if we can make everything reproducible and open. So a scientist at another university or research institution can check out the work, add their contributions and publish another paper building on that research. It enables traceability in data – but it also enables science to progress at a faster rate than it has in the past.

THE TEAM’S WINNING PROJECT
Open-Source Approach to 3-D Communication
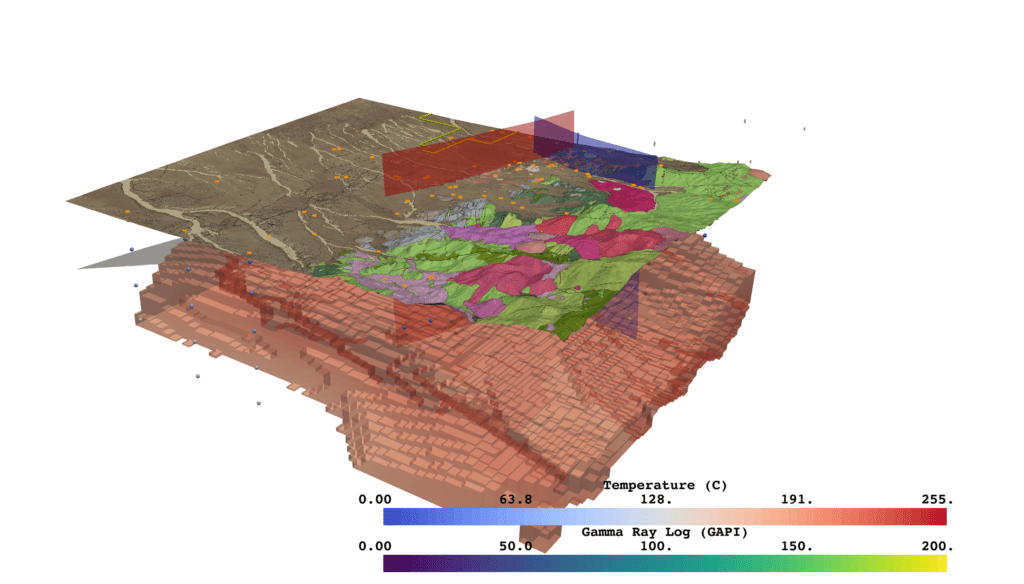
A suite of open-source Python packages, enabling available data sets to be incrementally integrated into a 3-D scene, was used in this submission. Tools used include The Open Mining Format, ParaView, SGeMS, and SimPEG, along with additional tools made by the team itself. 3-D visualisations such as this submission could enable researchers and scientists to rapidly explore data, communicate findings, and facilitate the reproducibility of results.


